

Every point, a decision.
Renokta delivers end-to-end turnkey IoT projects on its own IoT platform, shaped to your requirements and built to scale. You work with one team from sensor to report.
Energy monitoring
Sample data · --:--:--
Live power
522.4kW
Today's output
1,636kWh
Specific yield
2.36kWh/kWp
Performance ratio
81.3%
Energy flow
ProducingPlants
3Rooftop PV
120 kWp
91.7kW
Factory PV
72 kWp
52.6kW
Ground PV
500 kWp
383.6kW
CO2 avoided today0.82 t
Daily production
PowerIrradiancePrevious day
Alarms
2 active- 0Critical
- 0Major
- 0Minor
- 2Warning
- Active
Low insulation resistance
Warning · 24 min ago
- Active
Inverter communication delay
Warning · 2 h ago
Production heat map
Last 6 days · hourly
Sample screen. Values are simulated.
Data flows from field to decision.
Device data reaches the platform through the gateway. The platform normalizes it, raises alarms and delivers results to your team.
The diagram shows the logic; names are examples.
From sensor to report, one team.
Our engineering team builds your project from start to finish and brings it into operation. We serve these areas on the same platform.
End-to-end turnkey IoT
- 1Discovery
- 2Design
- 3Installation
- 4Commissioning
- 5Operation
Discovery
Measurement points, network and software needs are defined.
The diagrams explain how it works; values are examples.
Temperature monitoring, carbon footprint calculation and sector-specific solutions are built on the same platform.
One platform, start to finish.
From the sensor in the field to the manager's screen, the whole flow comes together on the Renokta IoT platform.
PHYSICAL WORLD
Warehouse 3
Zone B
Cold storage unit
Temperature probe
Power meter
Door sensor
DIGITAL TWIN
Sample Company › Warehouse 3 › Zone B
CS-04 twin
temperature-18.7 °C
power2.6 kW
doorclosed
PHYSICAL WORLD
DIGITAL TWIN
Warehouse 3
Zone B
Cold storage unit
Temperature probe
Power meter
Door sensor
Sample Company › Warehouse 3 › Zone B
CS-04 twin
temperature-18.7 °C
power2.6 kW
doorclosed
TELEMETRY
COMMANDS
Model your real world
Build your site, zone and device structure as it is. Each device's digital twin shows live data and passes commands to the device.
Turn data into action
Convert data from different devices into one model, raise alarms only on real anomalies, and deliver events to your team and other systems.
MIXED DATA
ONE DATA MODEL
75.5 °F"t": "21,7"0x17TEMP_K=291.0MIXED DATA
ONE DATA MODEL
75.5 °F"t": "21,7"0x17TEMP_K=291.0
CONNECT DEVICES
- Sensors
- Gateways
- Machines
- Meters
BUILD SOLUTION
- Digital twins
- Rules
- Alarms
- Dashboards
SHARE WITH USERS
panel.example.com
Sample Water Utility
Water use
3.2 m³/sa
No alarms
CONNECT DEVICES
BUILD SOLUTION
SHARE WITH USERS
- Sensors
- Gateways
- Machines
- Meters
- Digital twins
- Rules
- Alarms
- Dashboards
panel.example.com
Sample Water Utility
Water use
3.2 m³/sa
No alarms
From device to end user
From device connection to dashboard, the whole use case is delivered in one project, with a ready interface for your team or customers.
The diagrams explain how it works; names, values and addresses are examples.
Our solutions
Five service areas plus sector-specific and topic solutions, all on one platform.
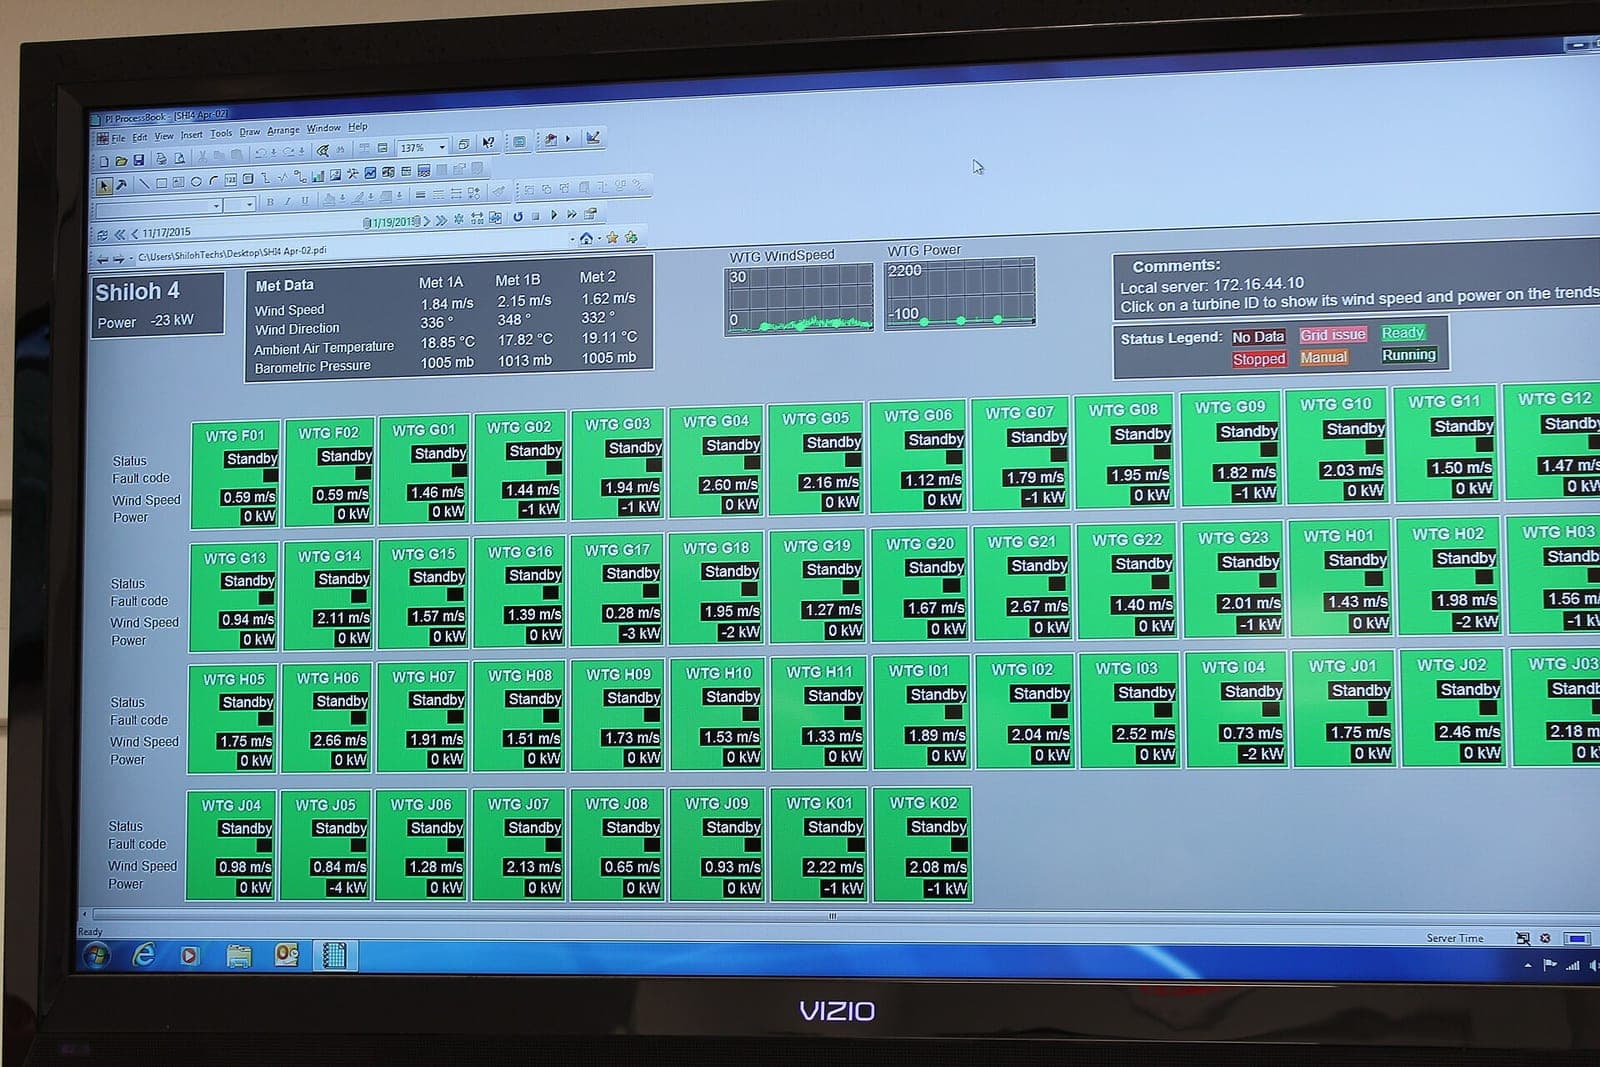
Energy SCADA and automation
Monitors, controls and manages your energy systems from a single screen with automation rules.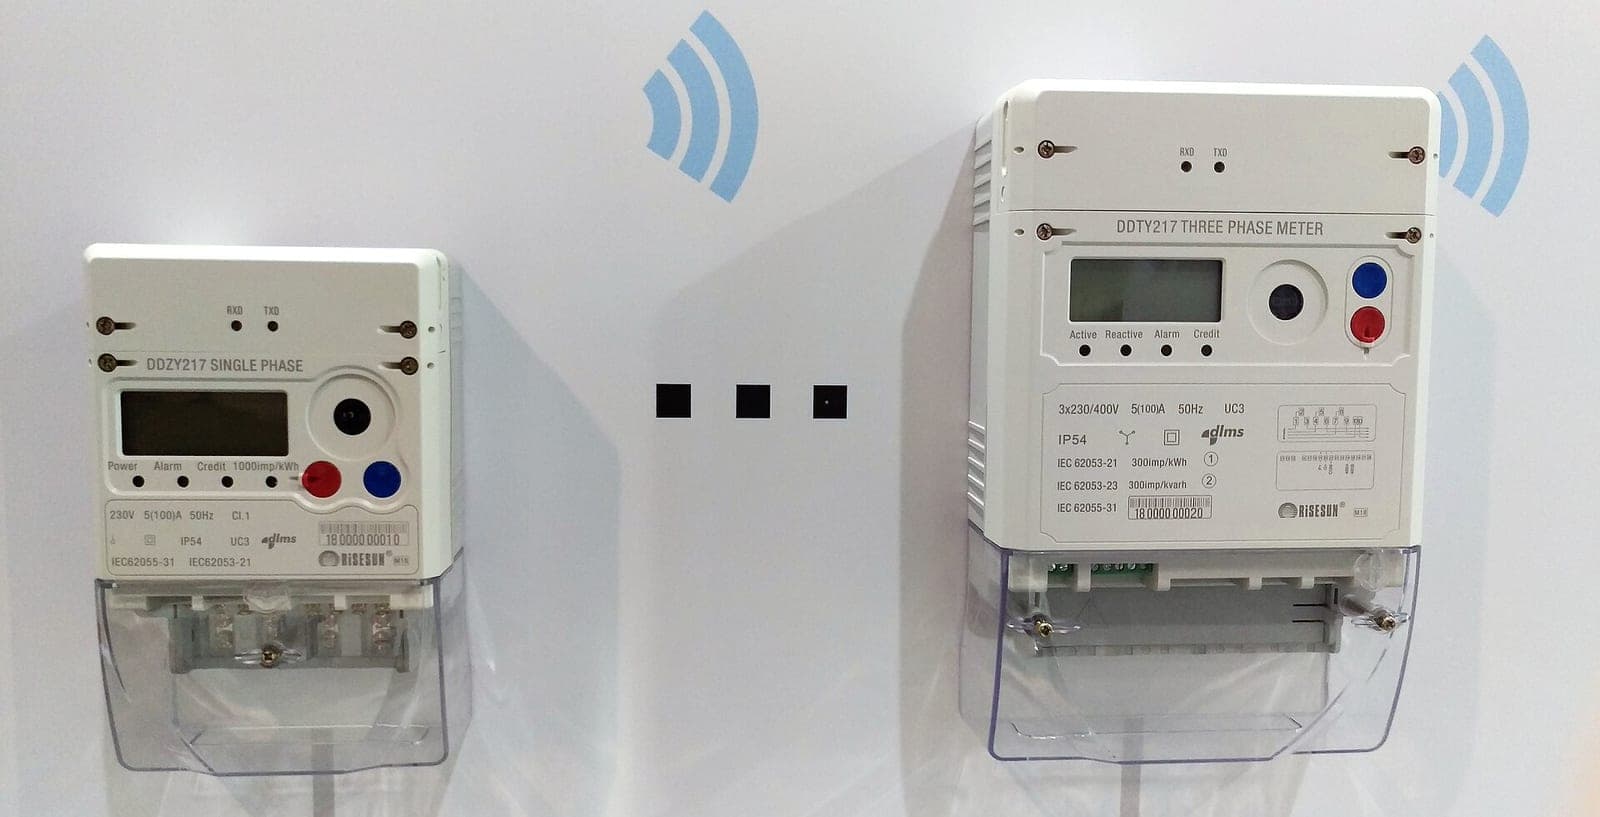
Energy analysis and anomaly detection
Analyzes consumption data, spots unusual behavior and prepares AI-assisted reports.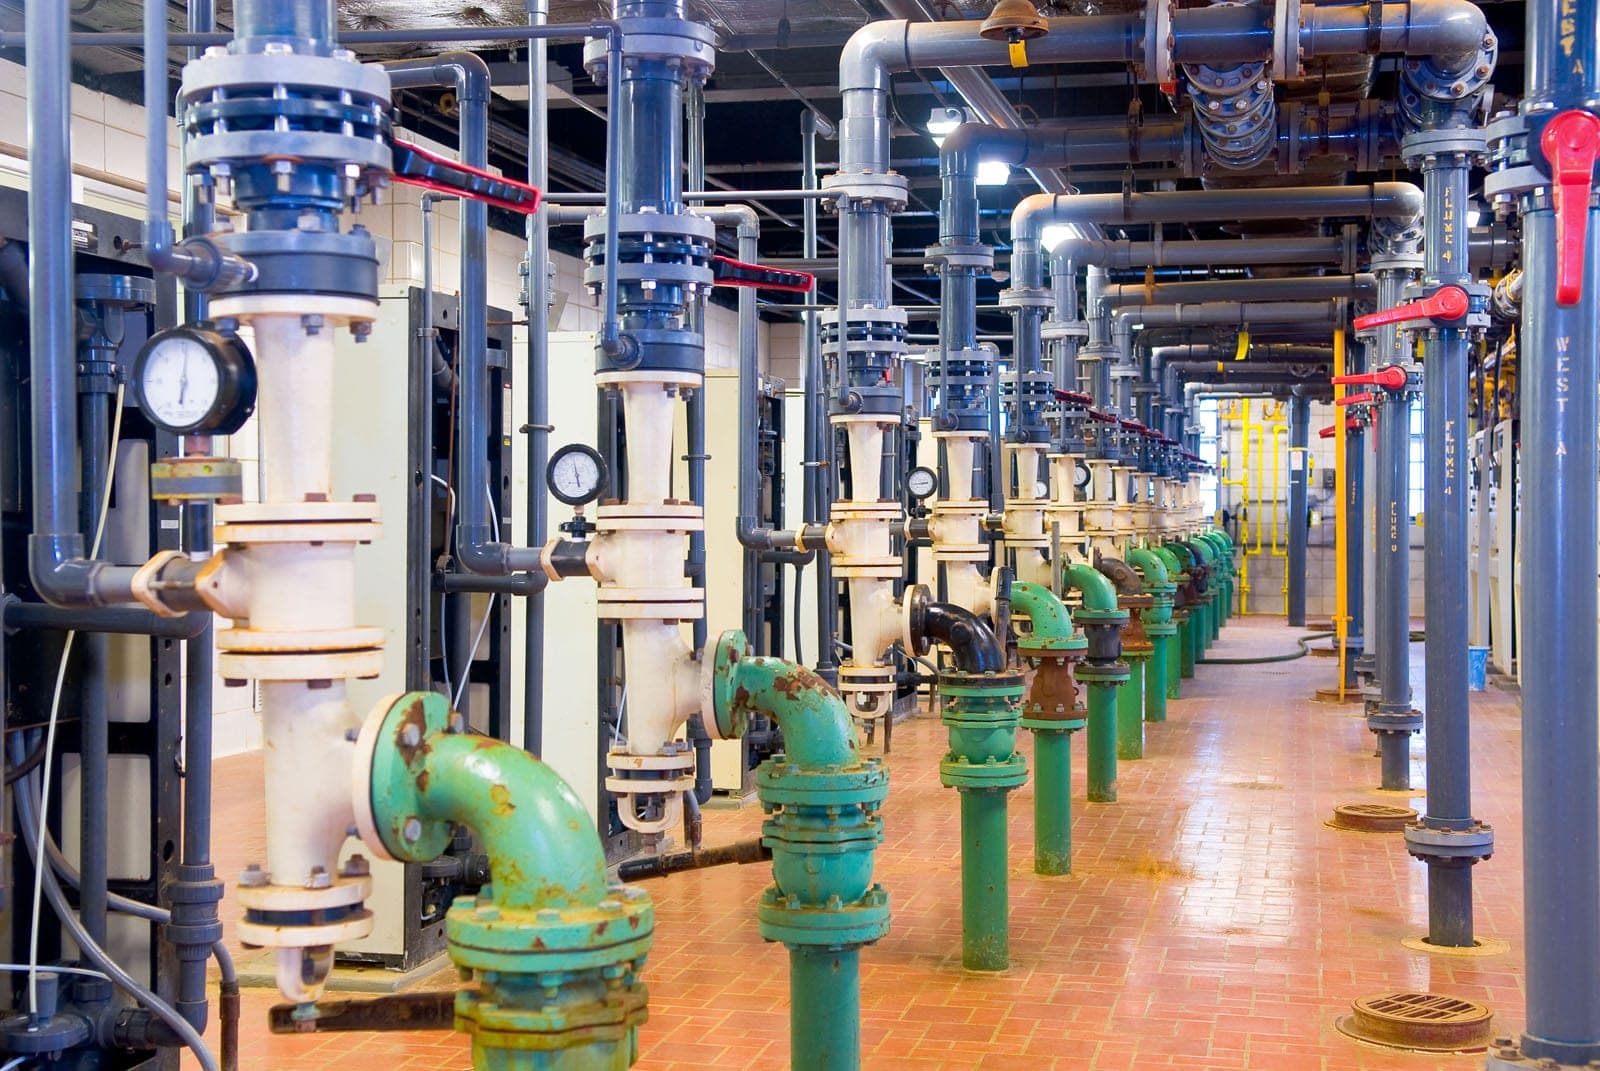
Water consumption monitoring
Monitors water use remotely over LoRaWAN sensors and reports leaks and unusual increases.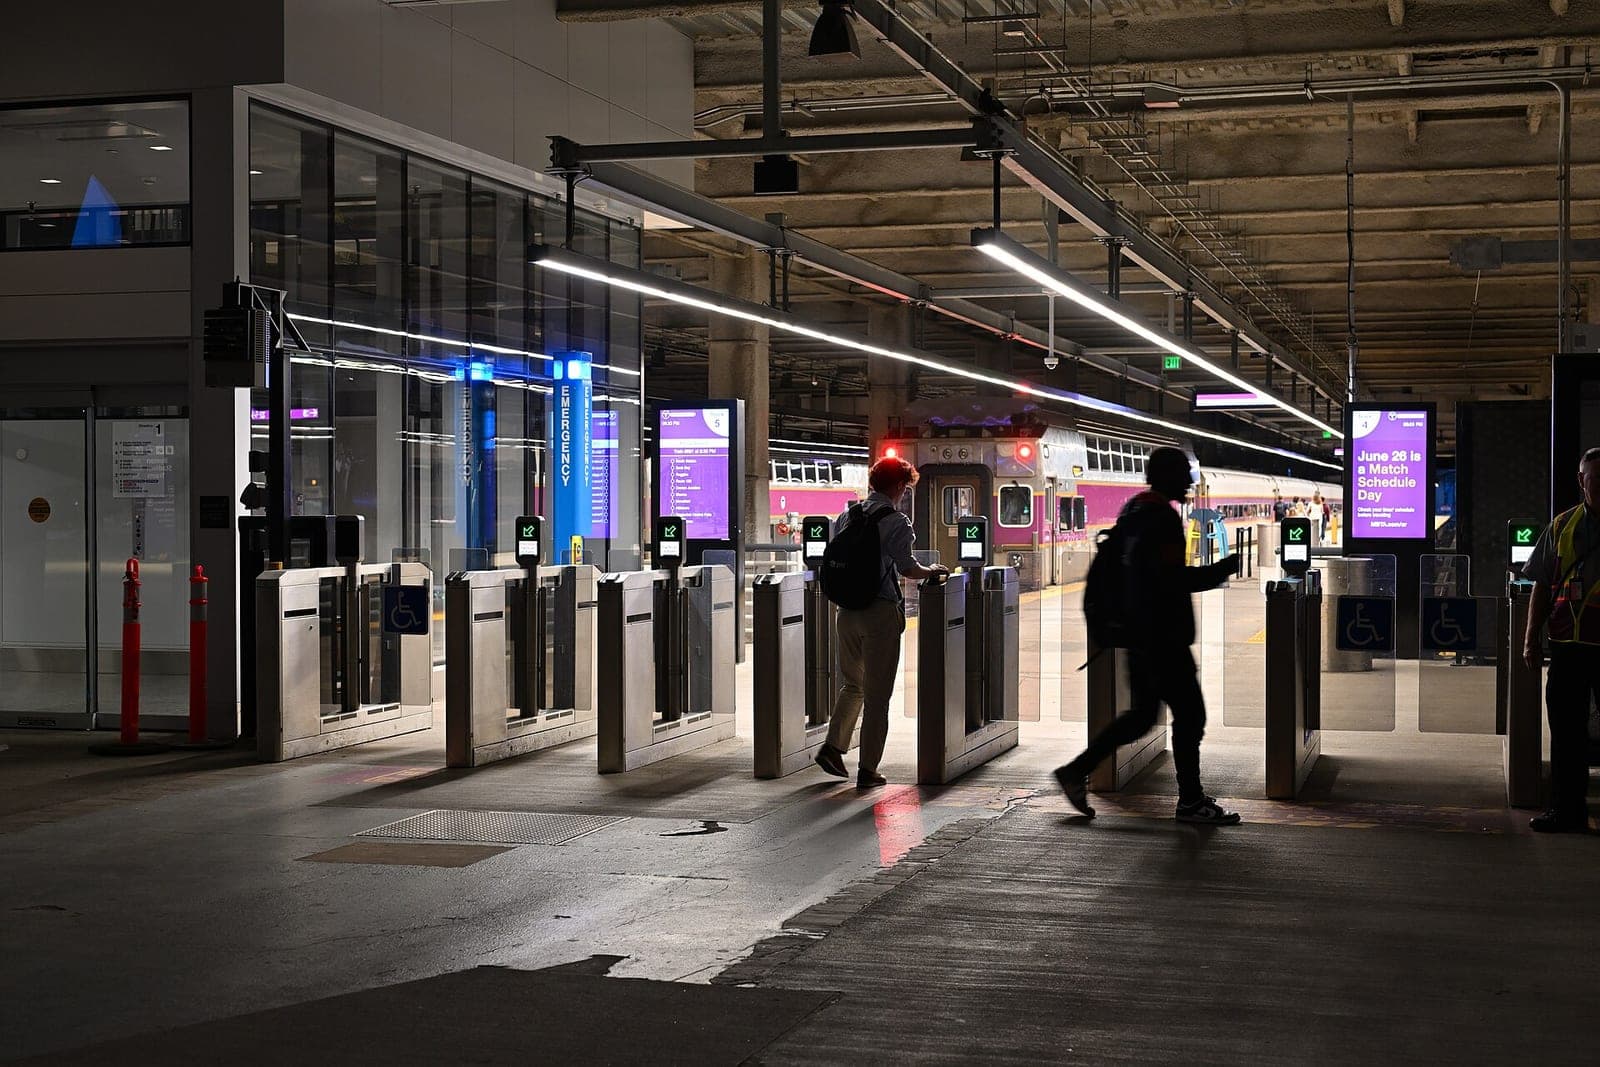
People counting systems
Counts entries and exits, shows live occupancy and reports on it.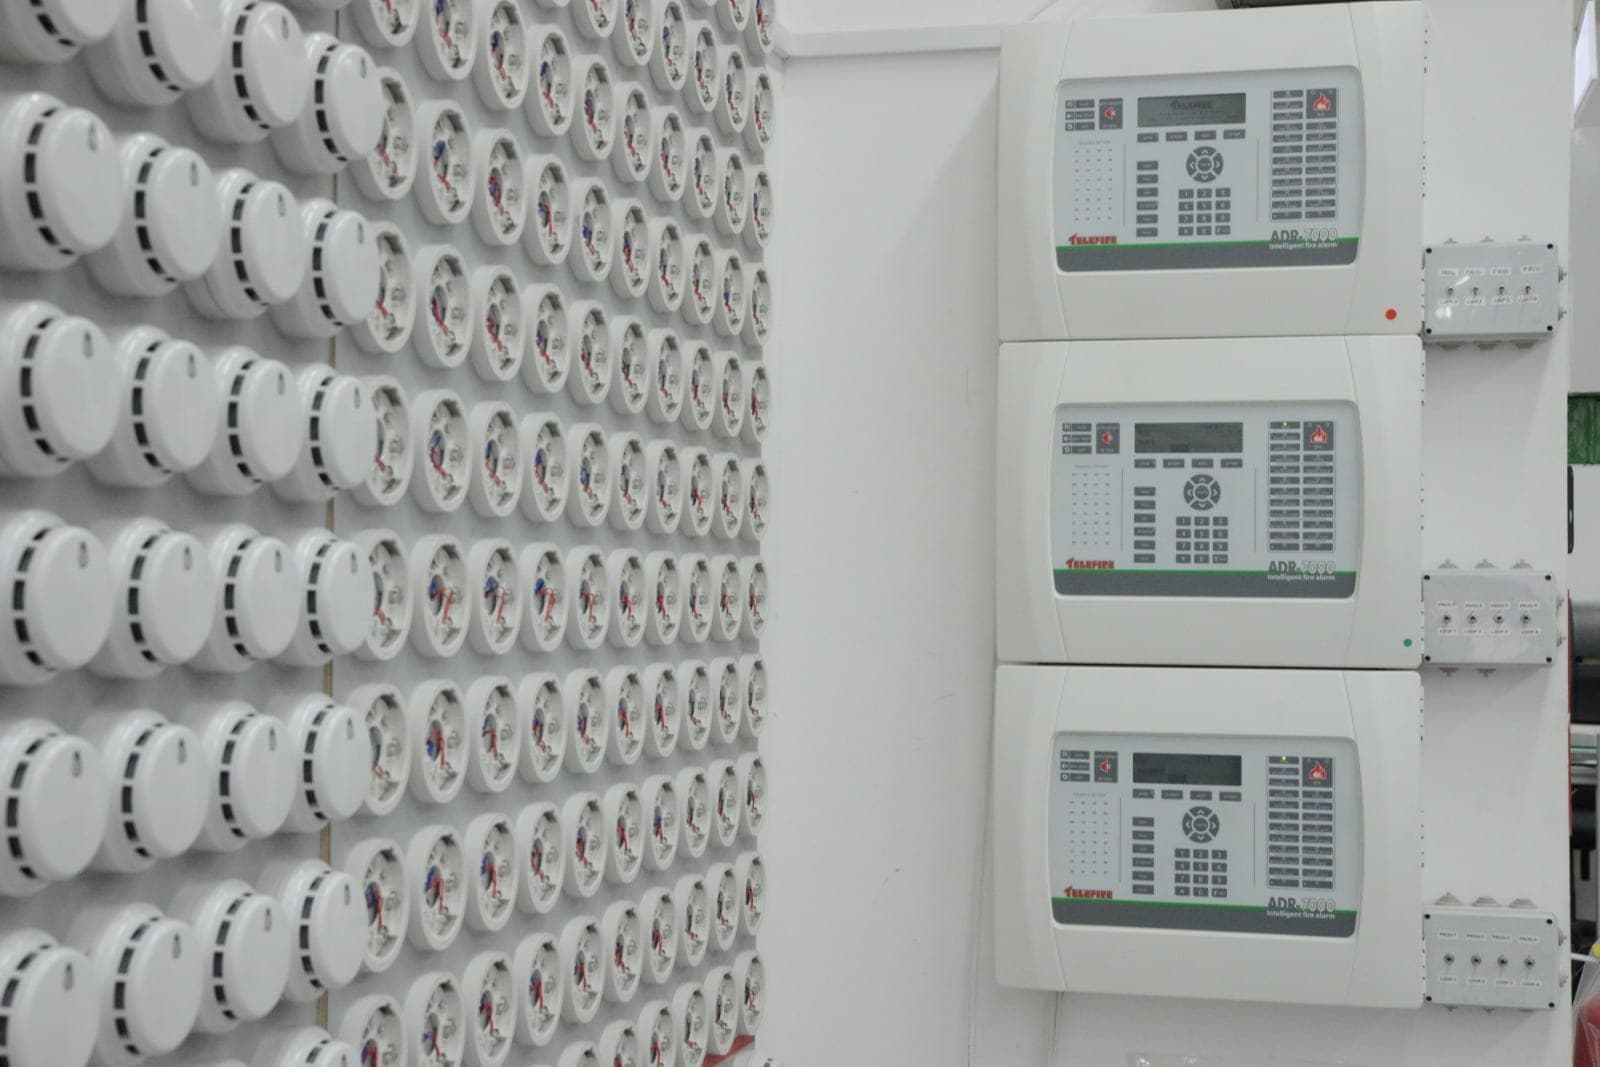
Emergency systems
Detects smoke, fire and similar emergencies and notifies the right people instantly.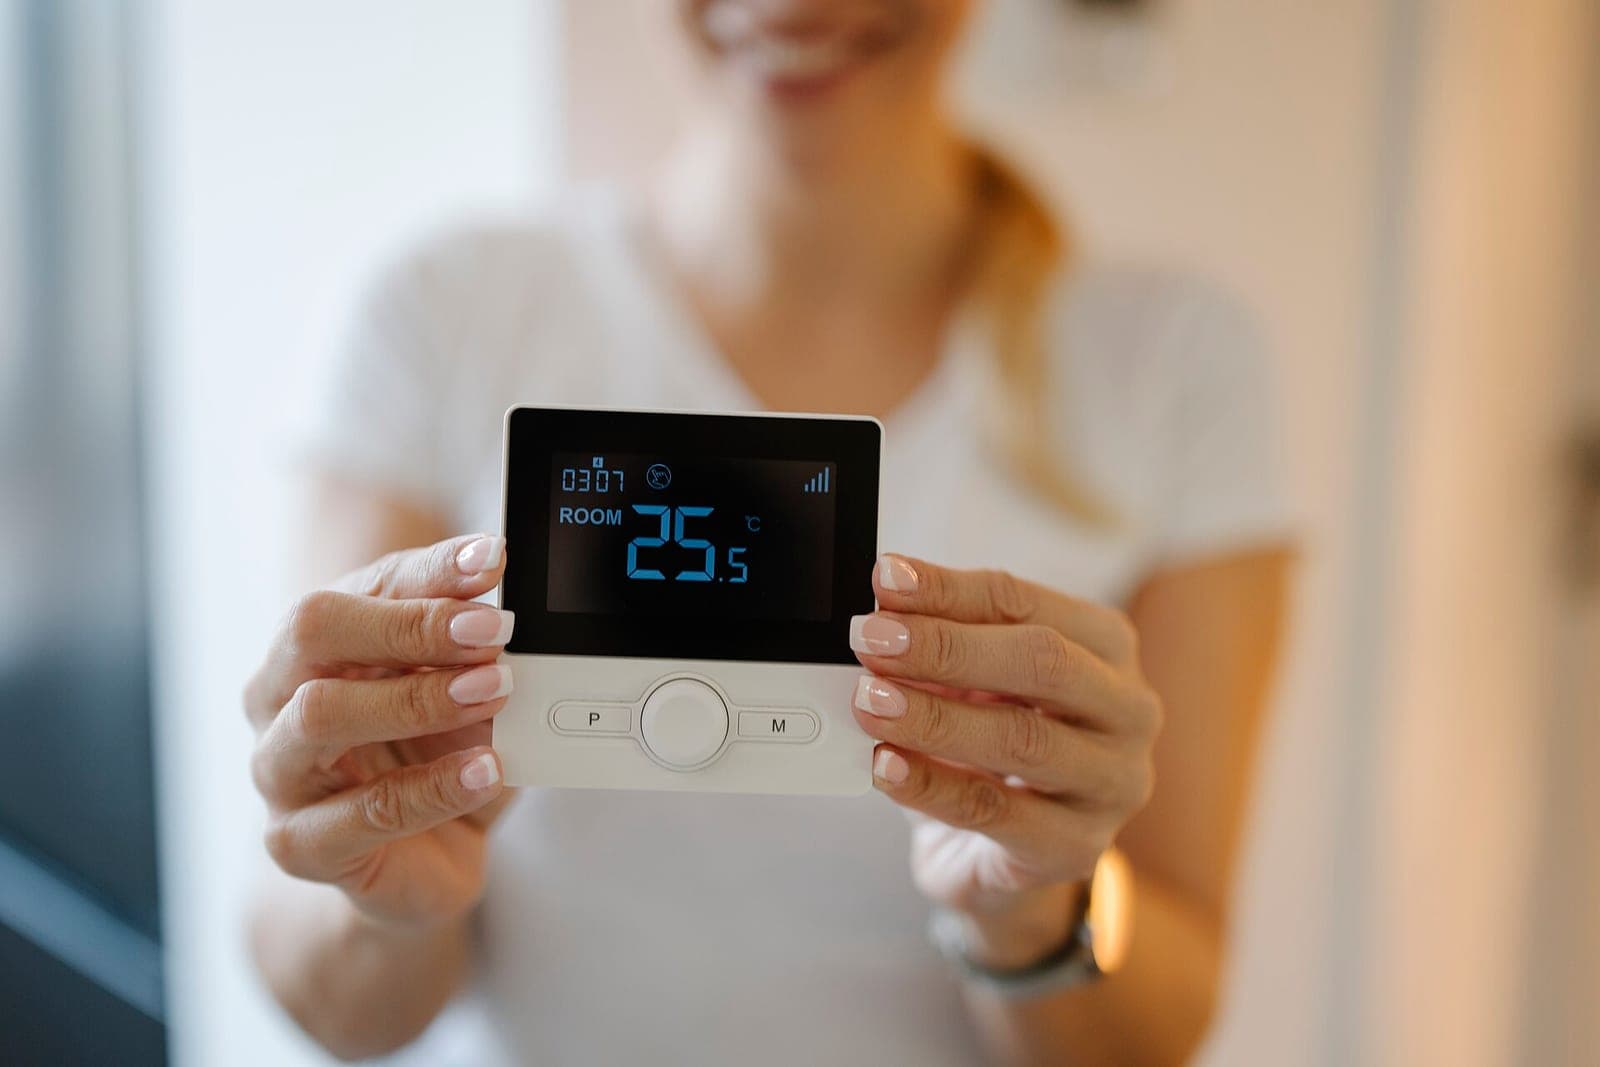
Smart hotel
Central control of rooms and shared areas improves energy efficiency and day-to-day operations.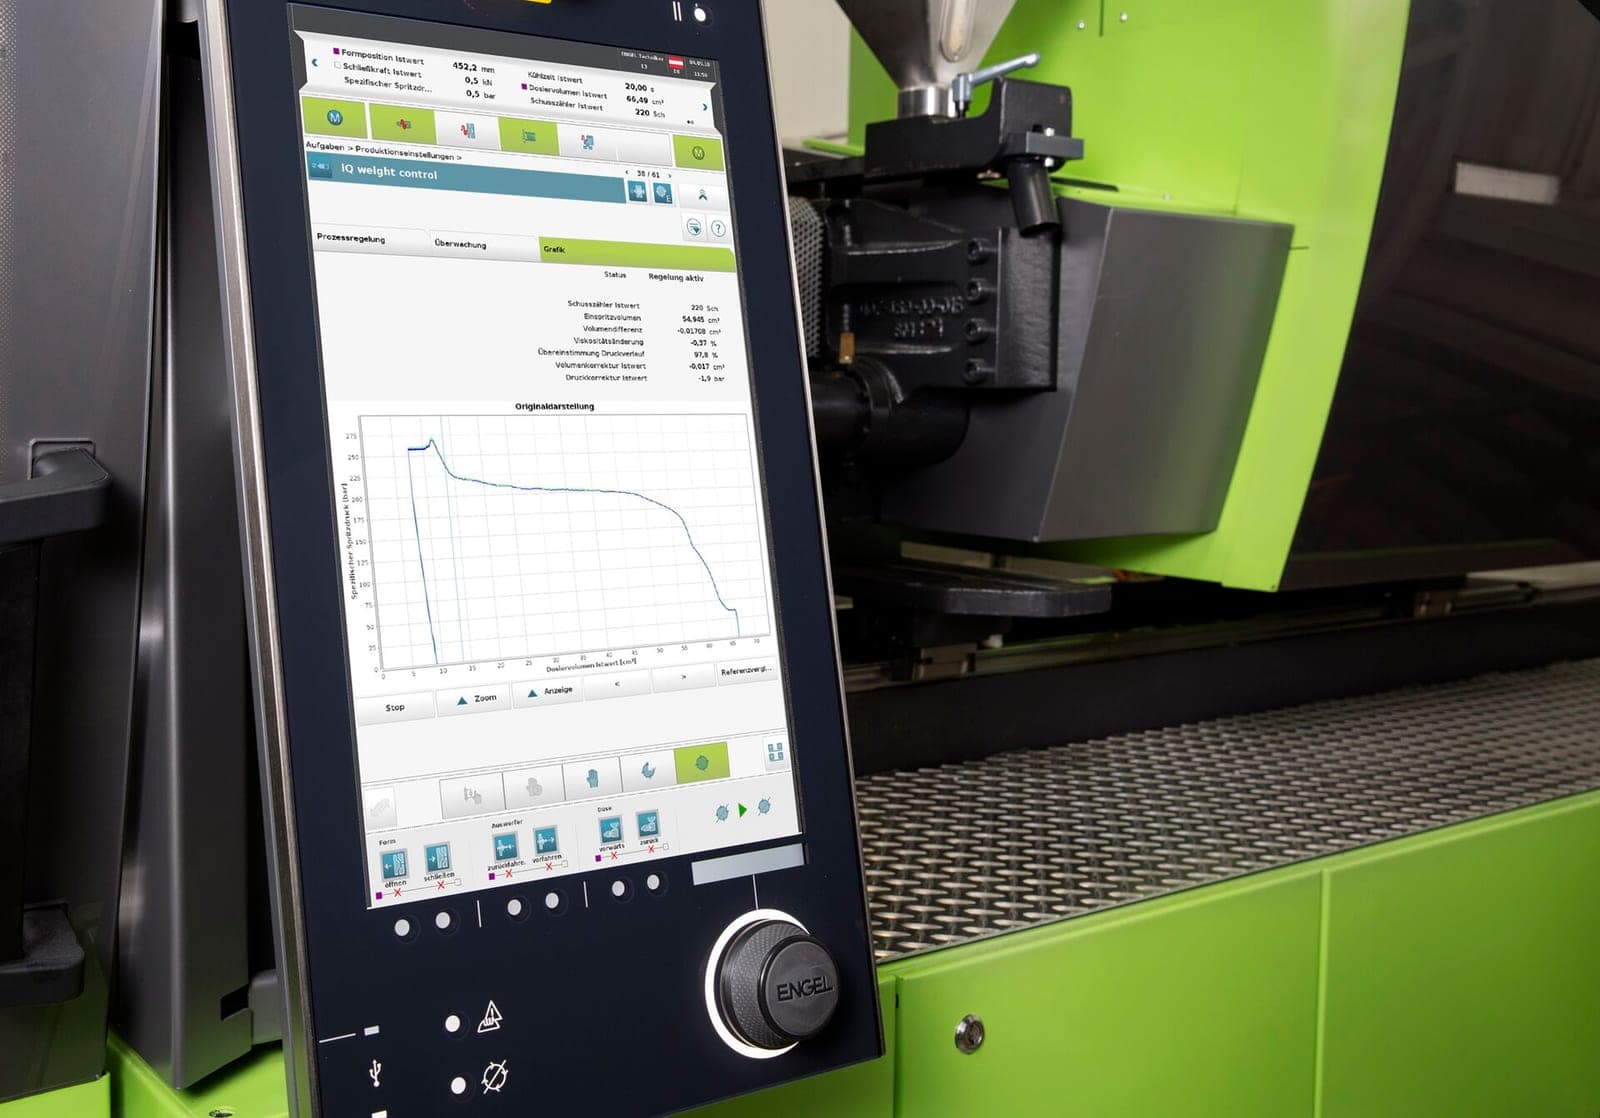
Smart factory (MES)
Real-time monitoring of machine performance, production data and energy use.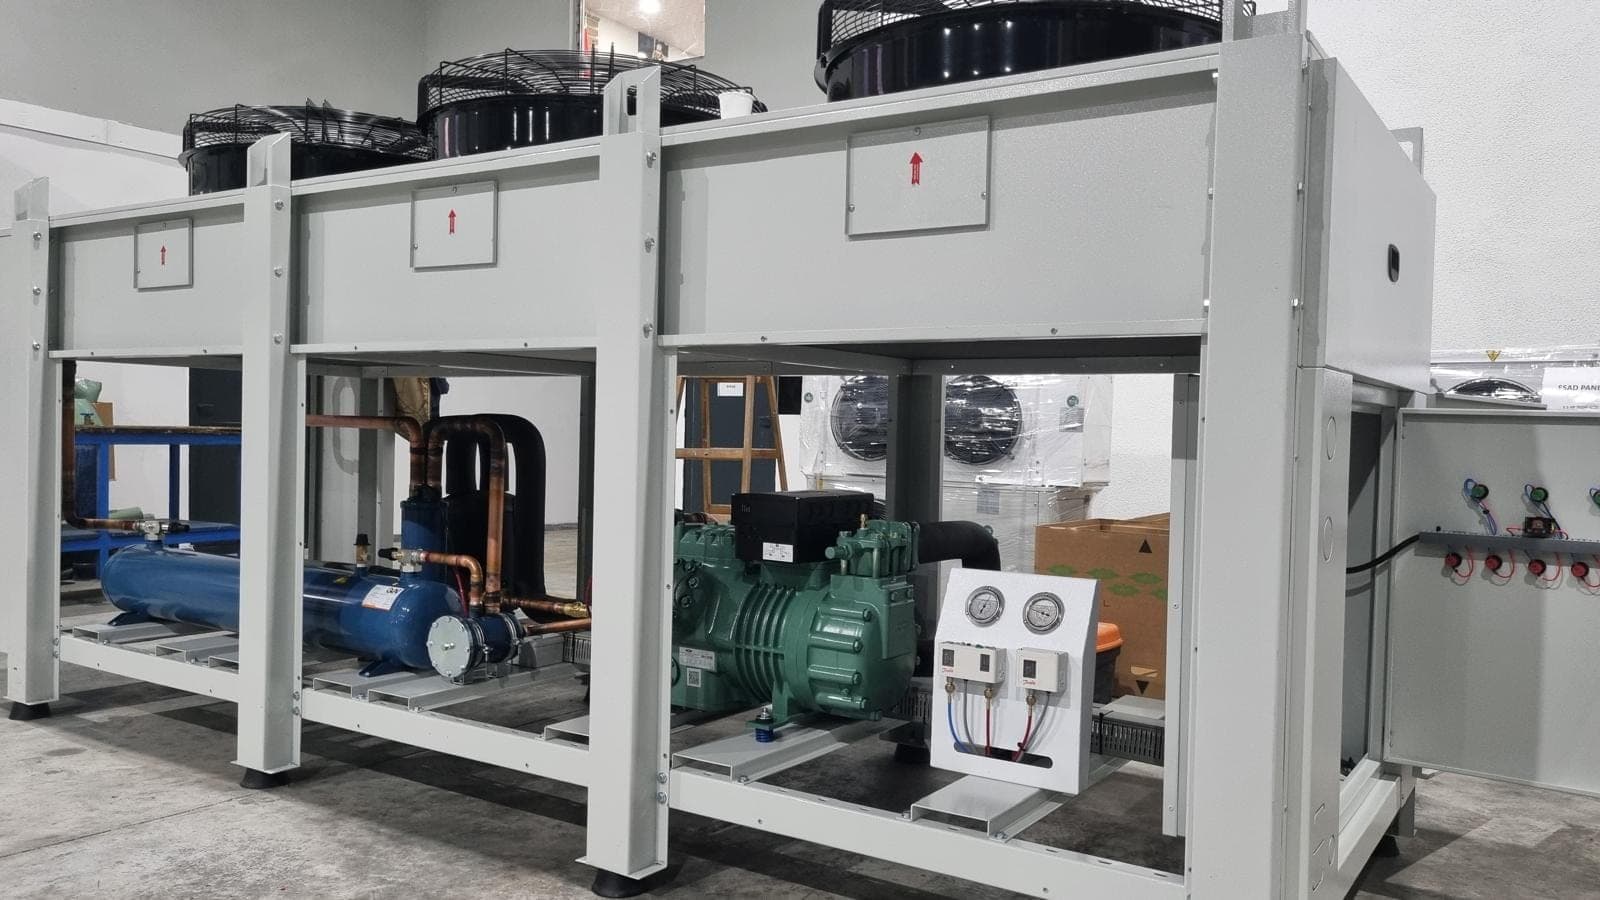
Cold chain and storage
Sensors, product and warehouse management, reporting and alarms in one place.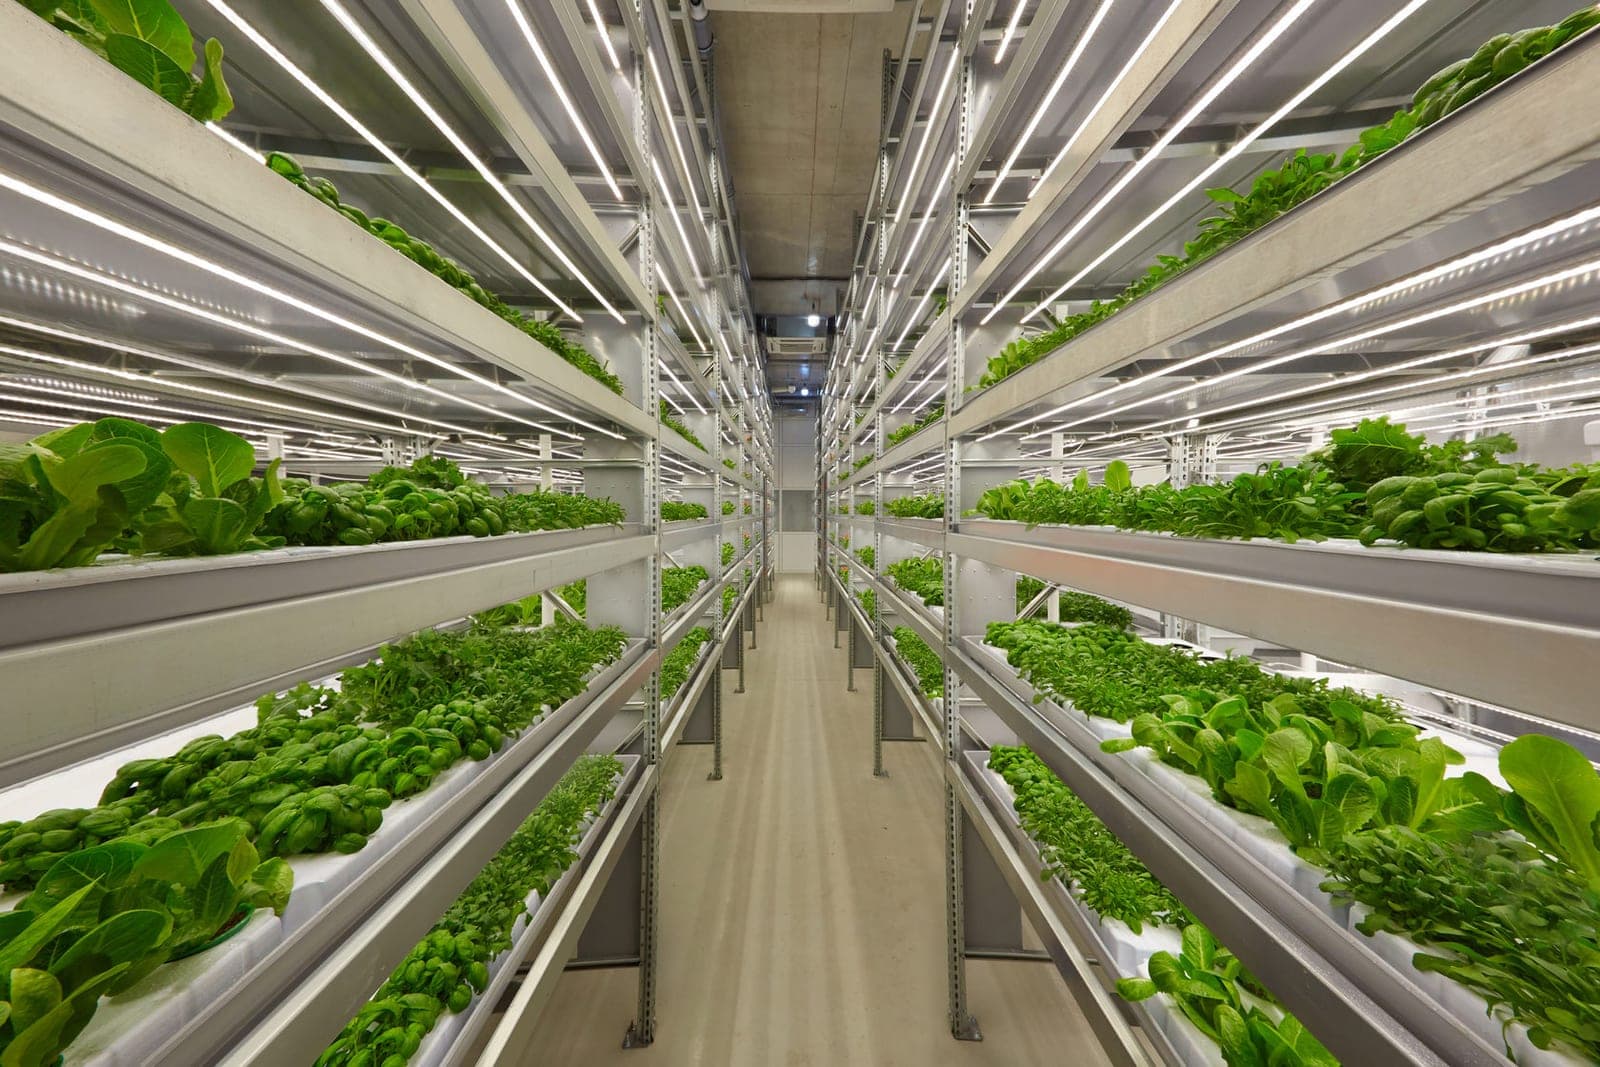
Smart agriculture and greenhouse
Monitors fields and greenhouses with sensors, so you can follow conditions such as irrigation water in one place.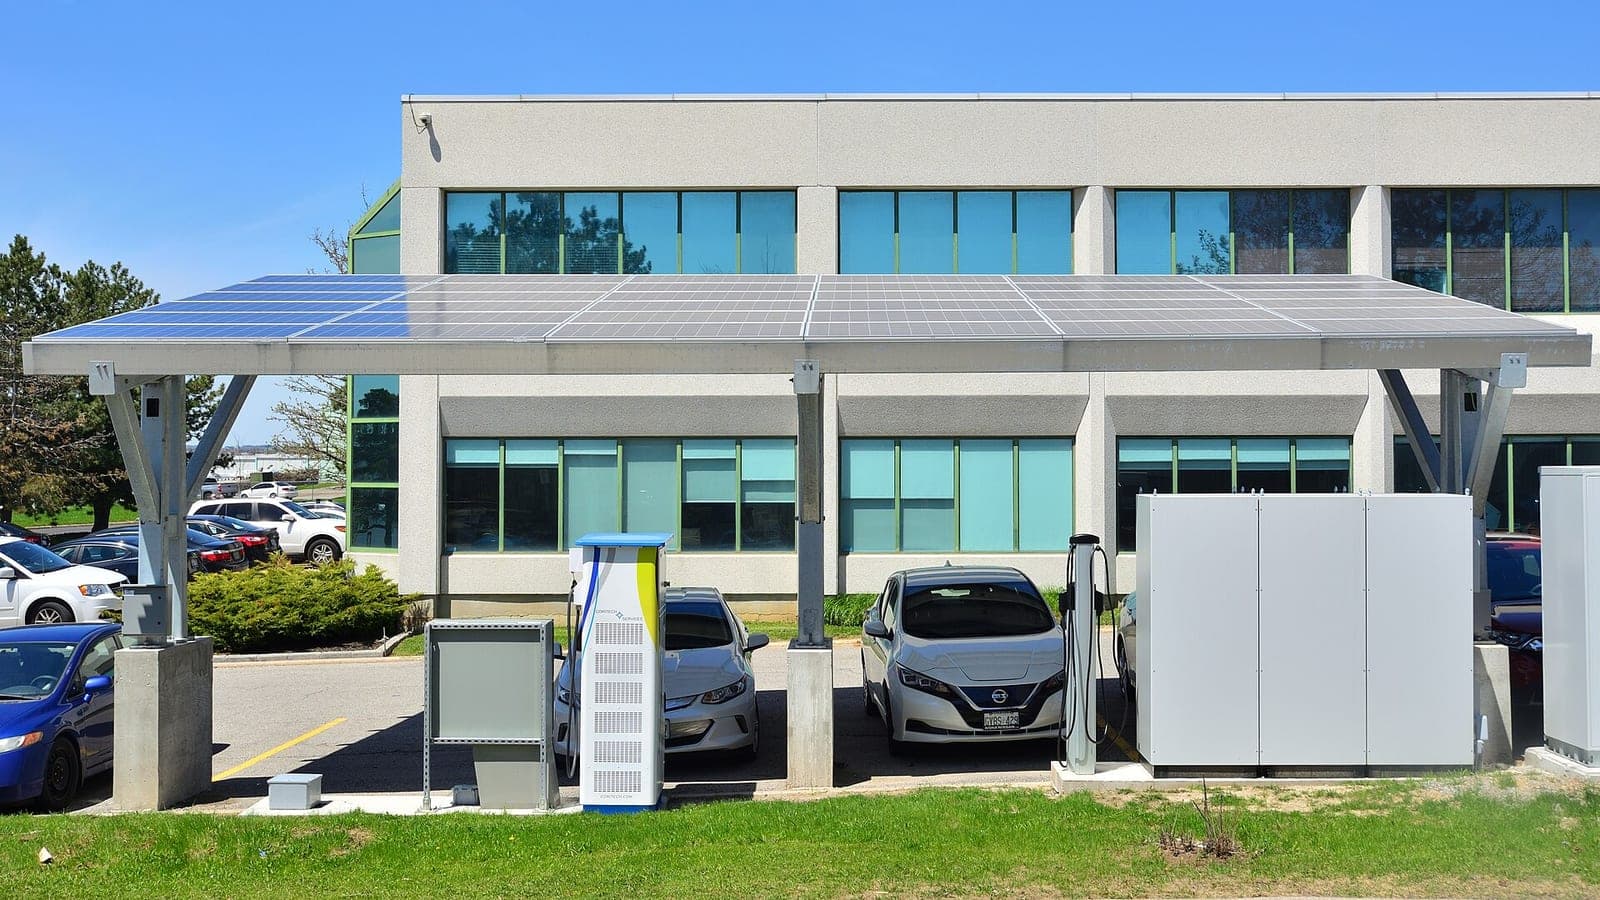
Energy management
Control over consumption and production, with detailed reporting.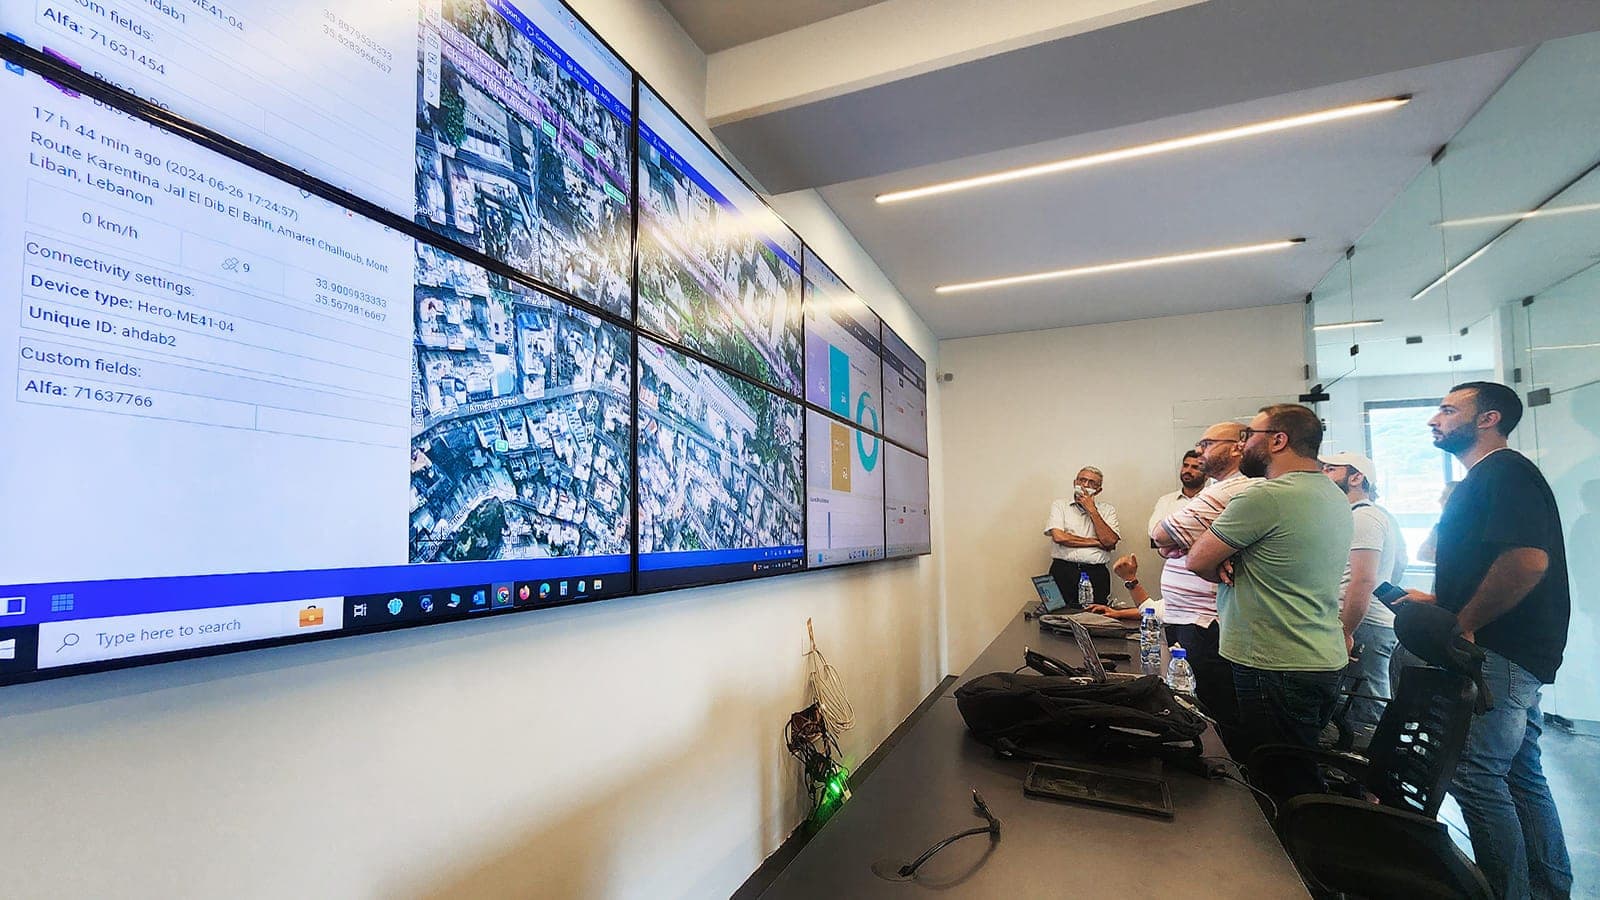
Vehicle tracking and fleet management
Location and vehicle data, alerts and reporting for vehicle fleets.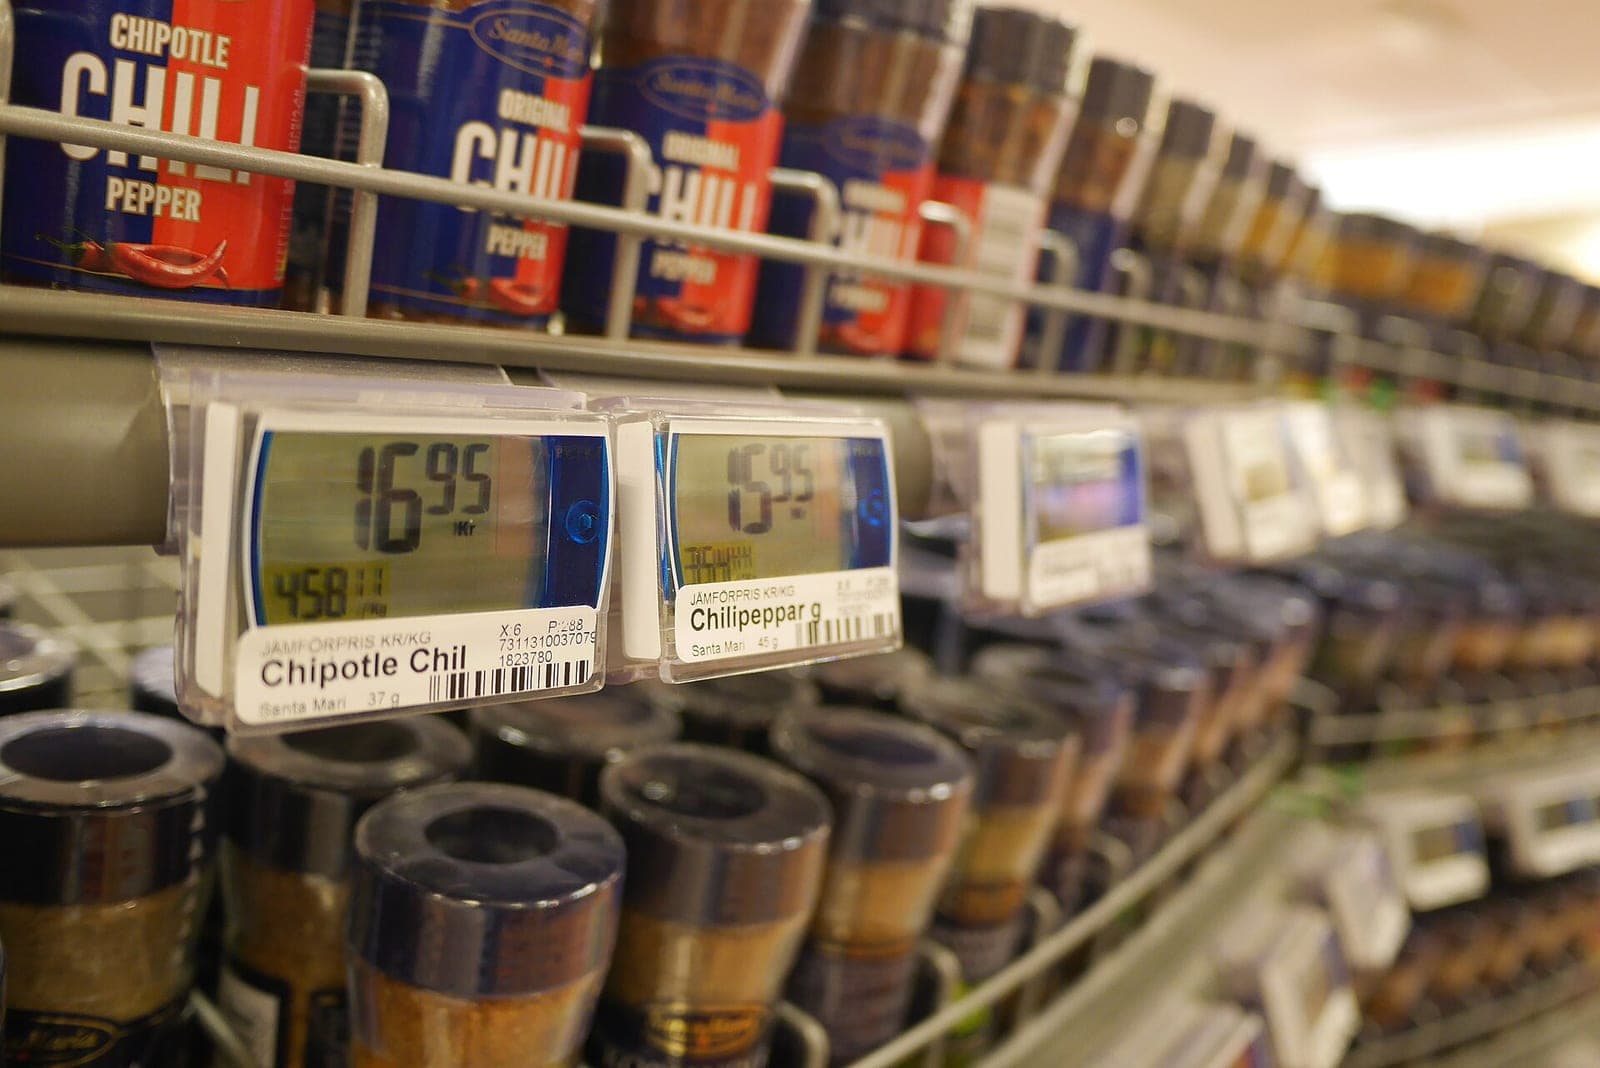
Smart office and retail
Measurement and control for office and retail environments.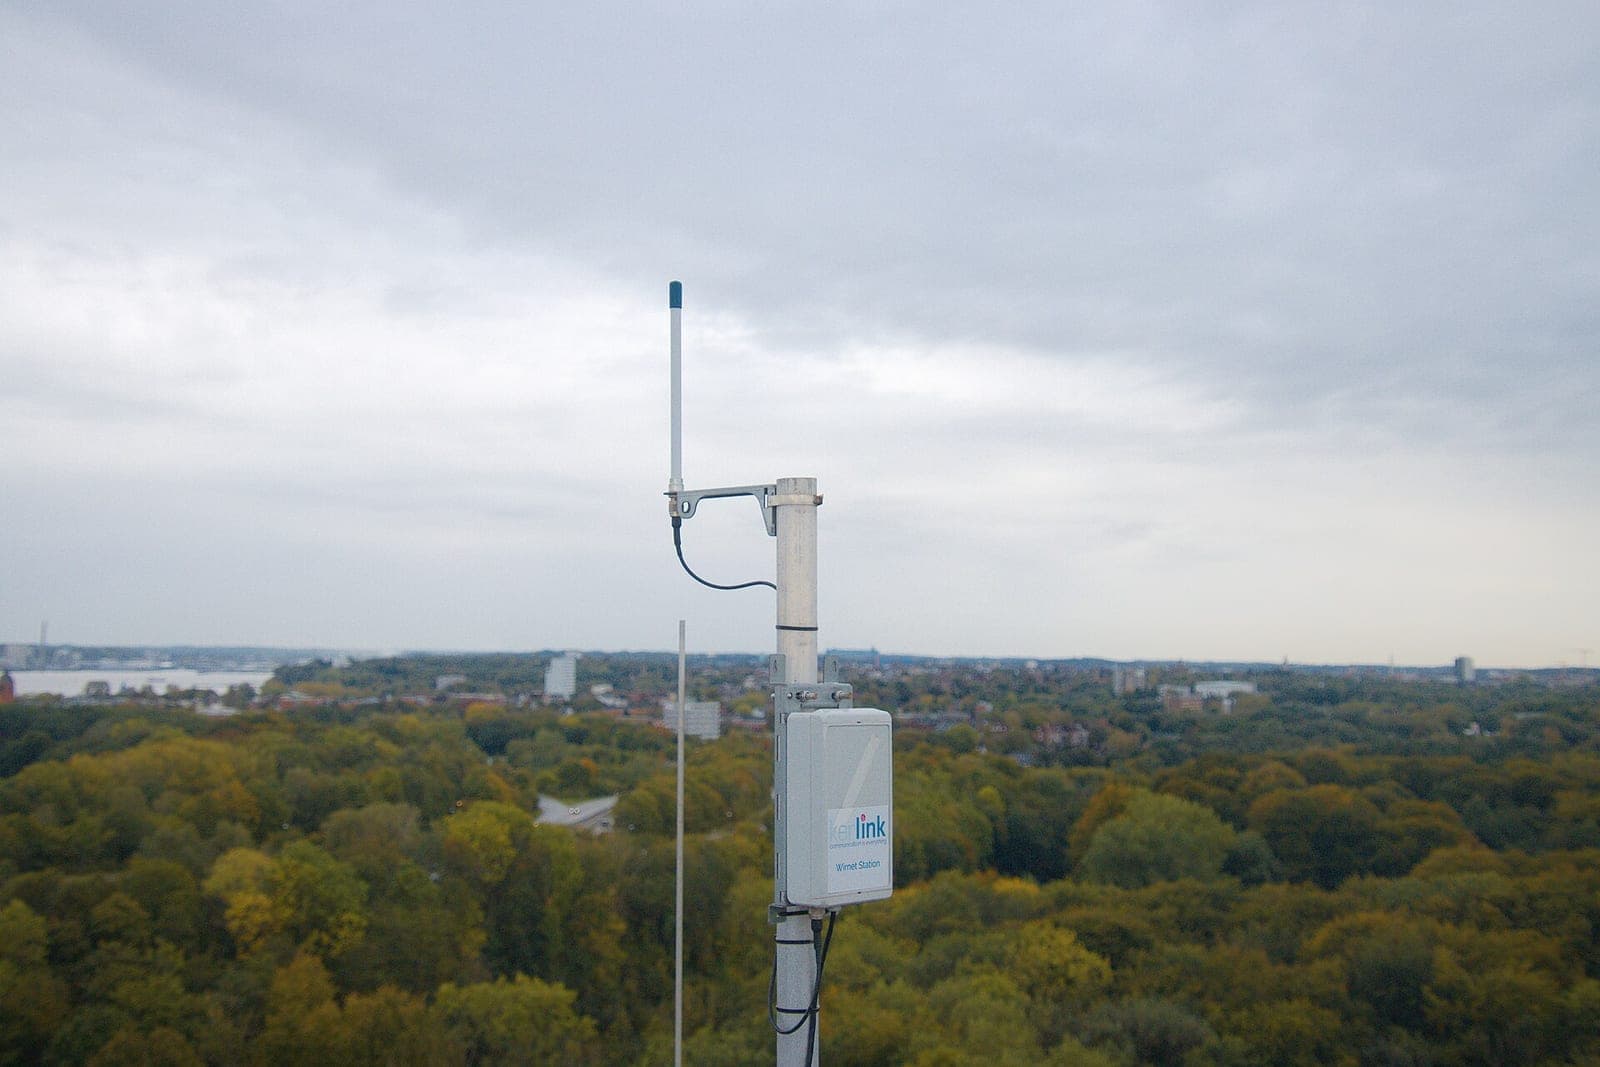
Custom solutions
Builds purpose-made systems for needs that do not fit standard categories.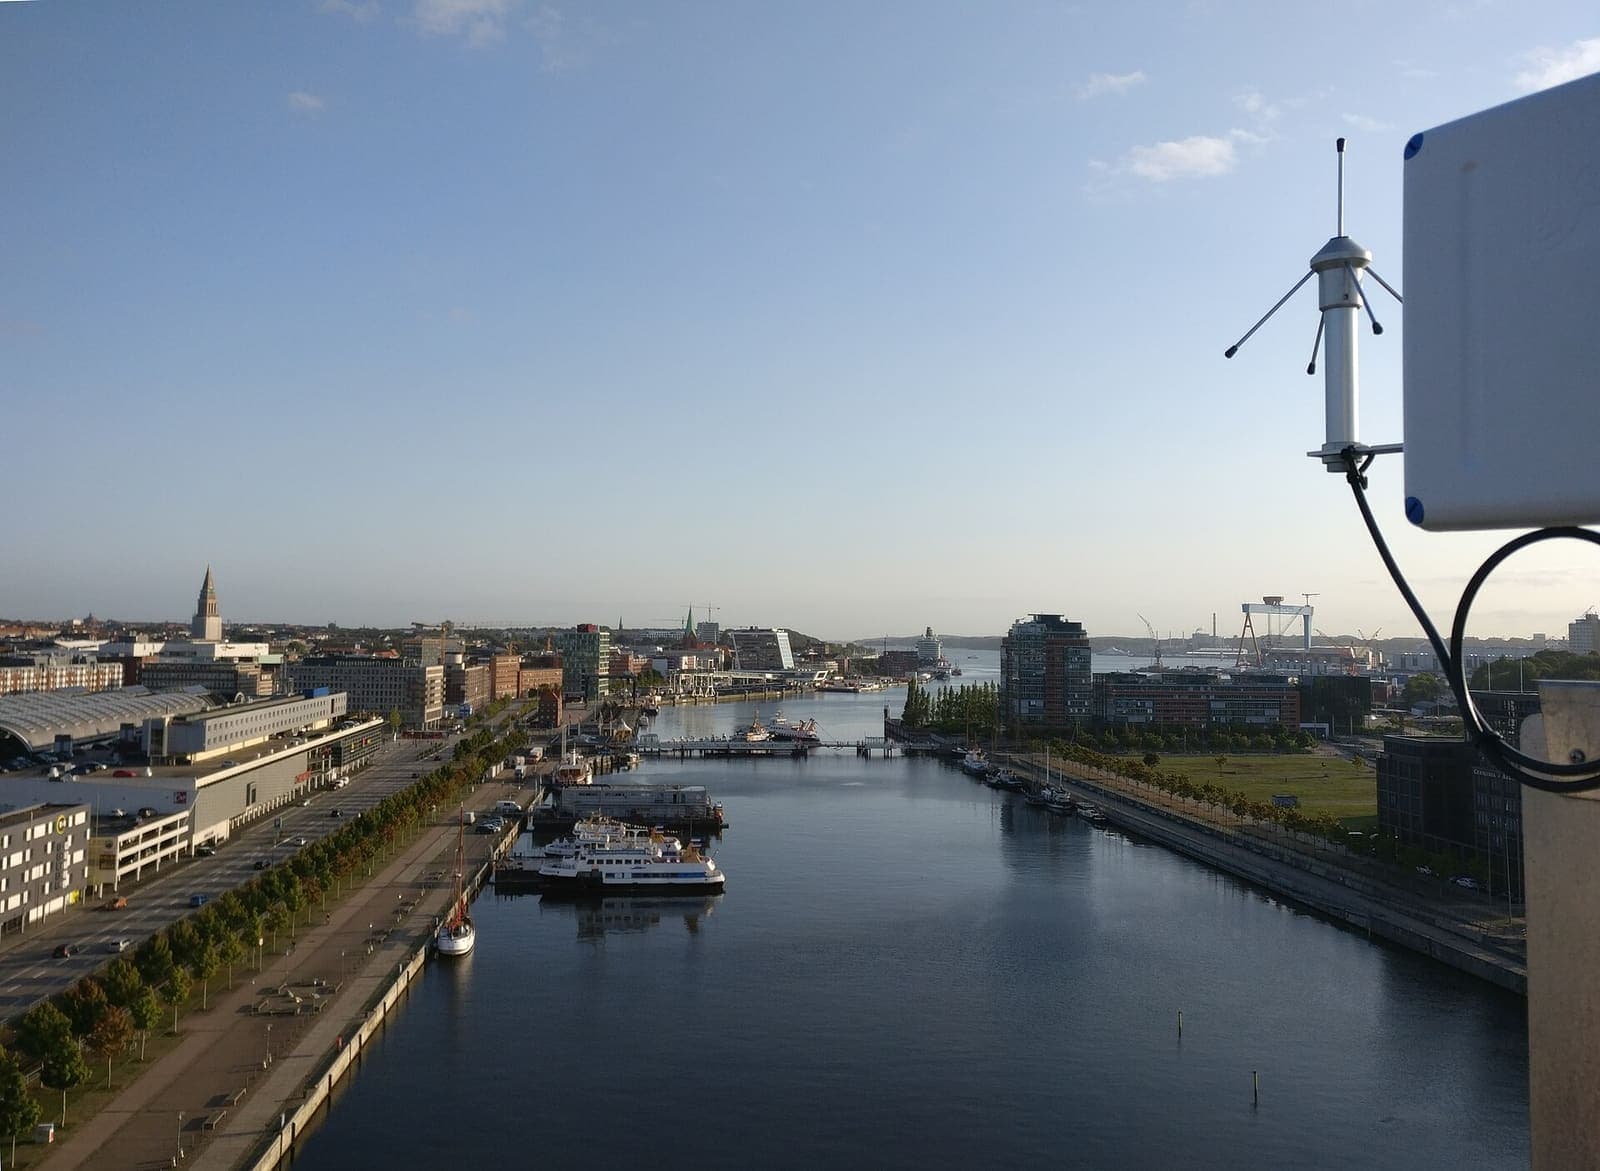
LoRaWAN sensor infrastructure
Builds the LoRaWAN network of gateways, sensors and platform and brings battery-powered sensor data from wide areas into one dashboard.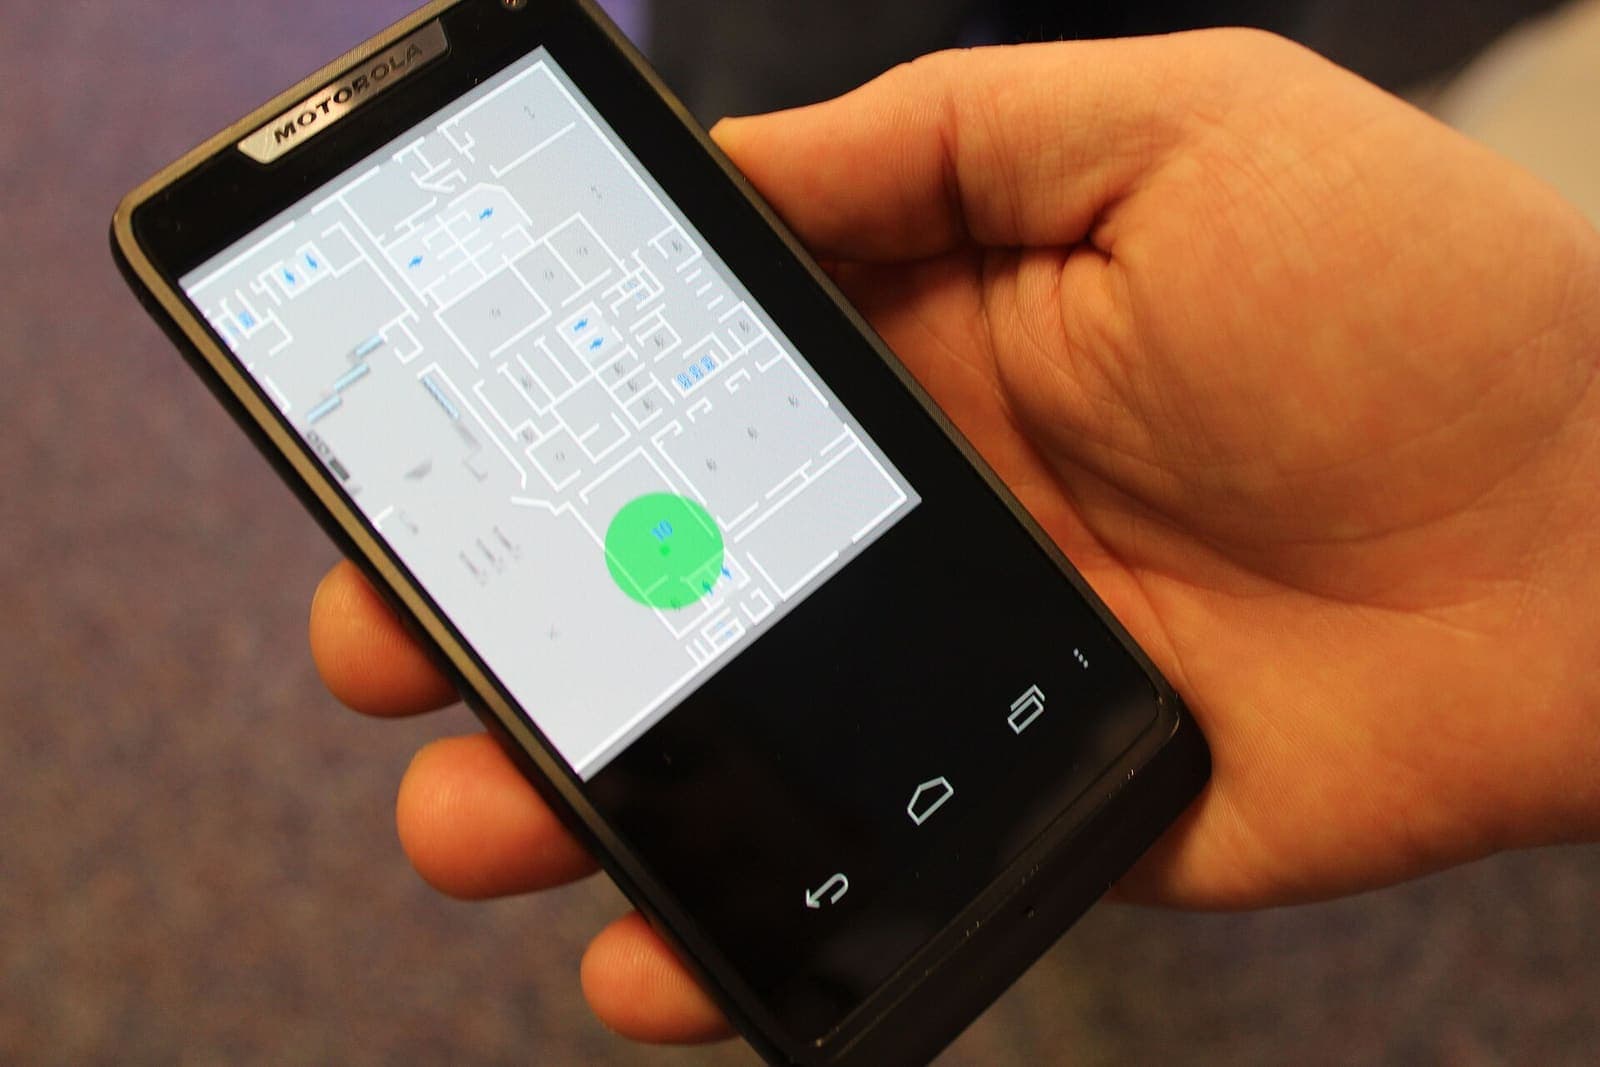
BLE sensor and location solutions
Tracks assets, occupancy and ambient data indoors with Bluetooth Low Energy tags and sensors.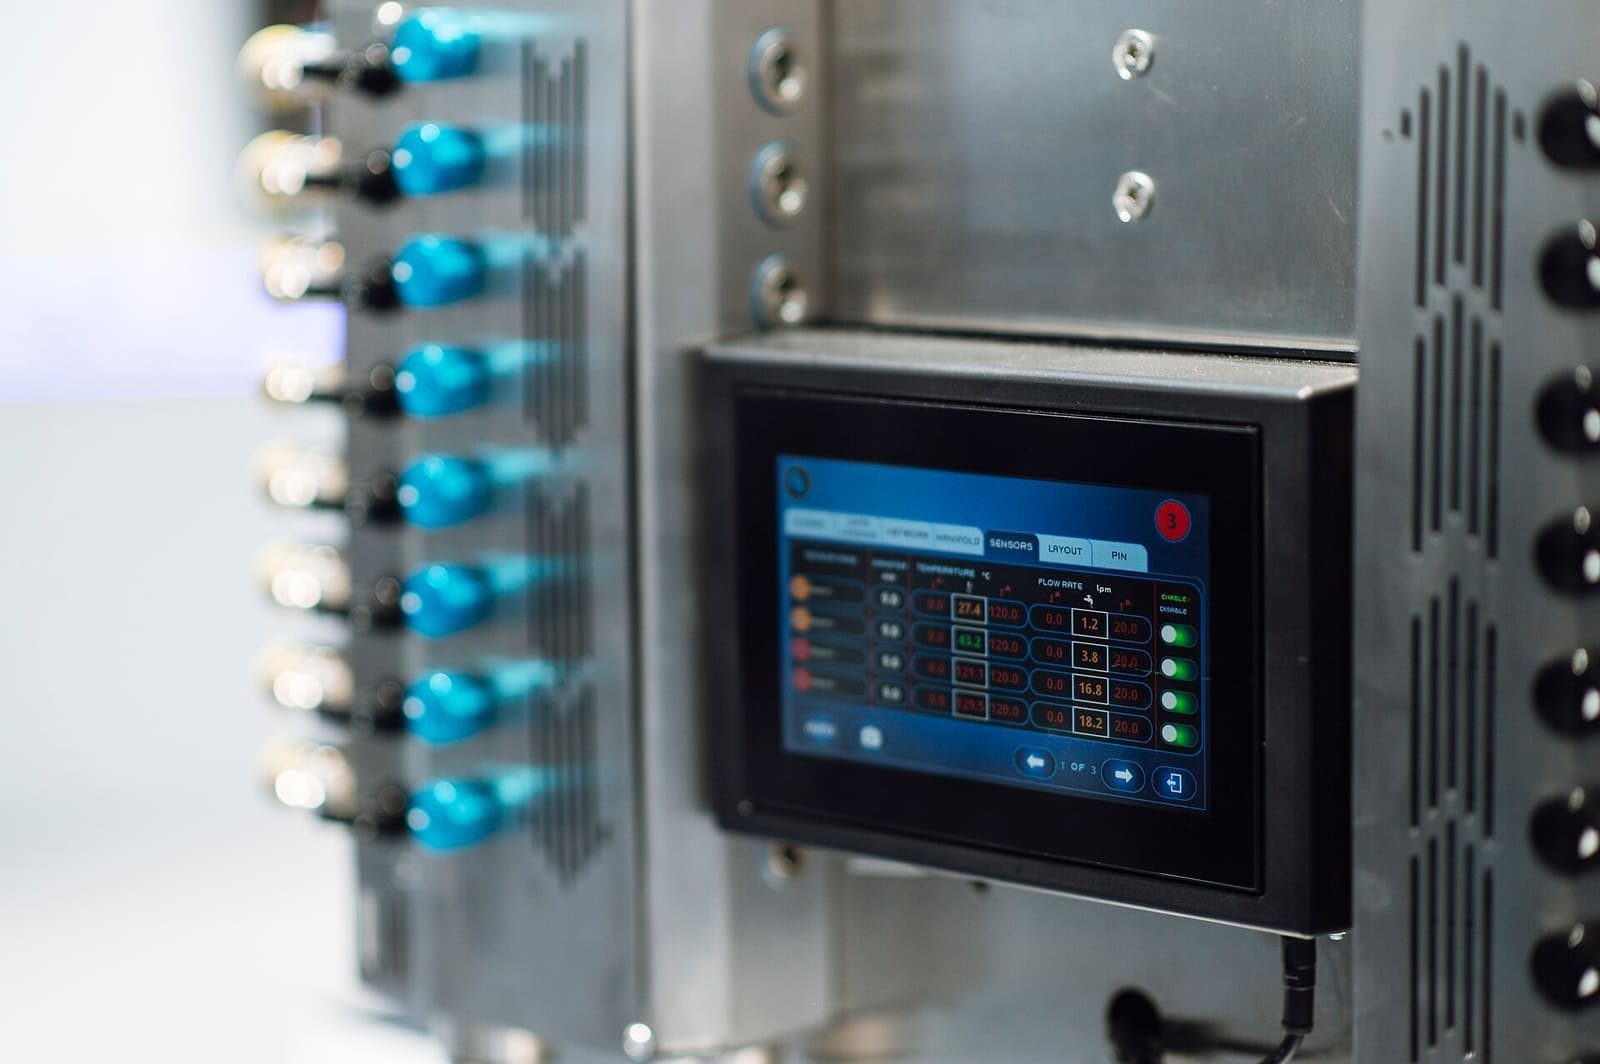
Energy monitoring for ISO 50001
Builds the measurement base an energy management system needs: sub-meter data, energy performance indicators and reports.
Carbon footprint monitoring
Collects the energy, fuel and process measurements needed for emission calculations and makes them reportable by scope.
Your project in four steps
From the first meeting to support after delivery, you work with the same team.
First meeting
We understand your needs and plan together.
Design
Our technical team designs the system and offers recommendations.
Demo
Your feedback shapes the final system.
Support and growth
Regular updates and support continue after delivery.