
What is energy monitoring for ISO 50001?
Energy monitoring for ISO 50001 is the measurement infrastructure an energy management system relies on: energy data is collected from sub-meters and equipment-level measurements, combined on a platform, turned into energy performance indicators (EnPIs) and reported. It feeds the standard's monitoring and measurement requirement; it does not grant certification, which is carried out by independent bodies.
How does it work?
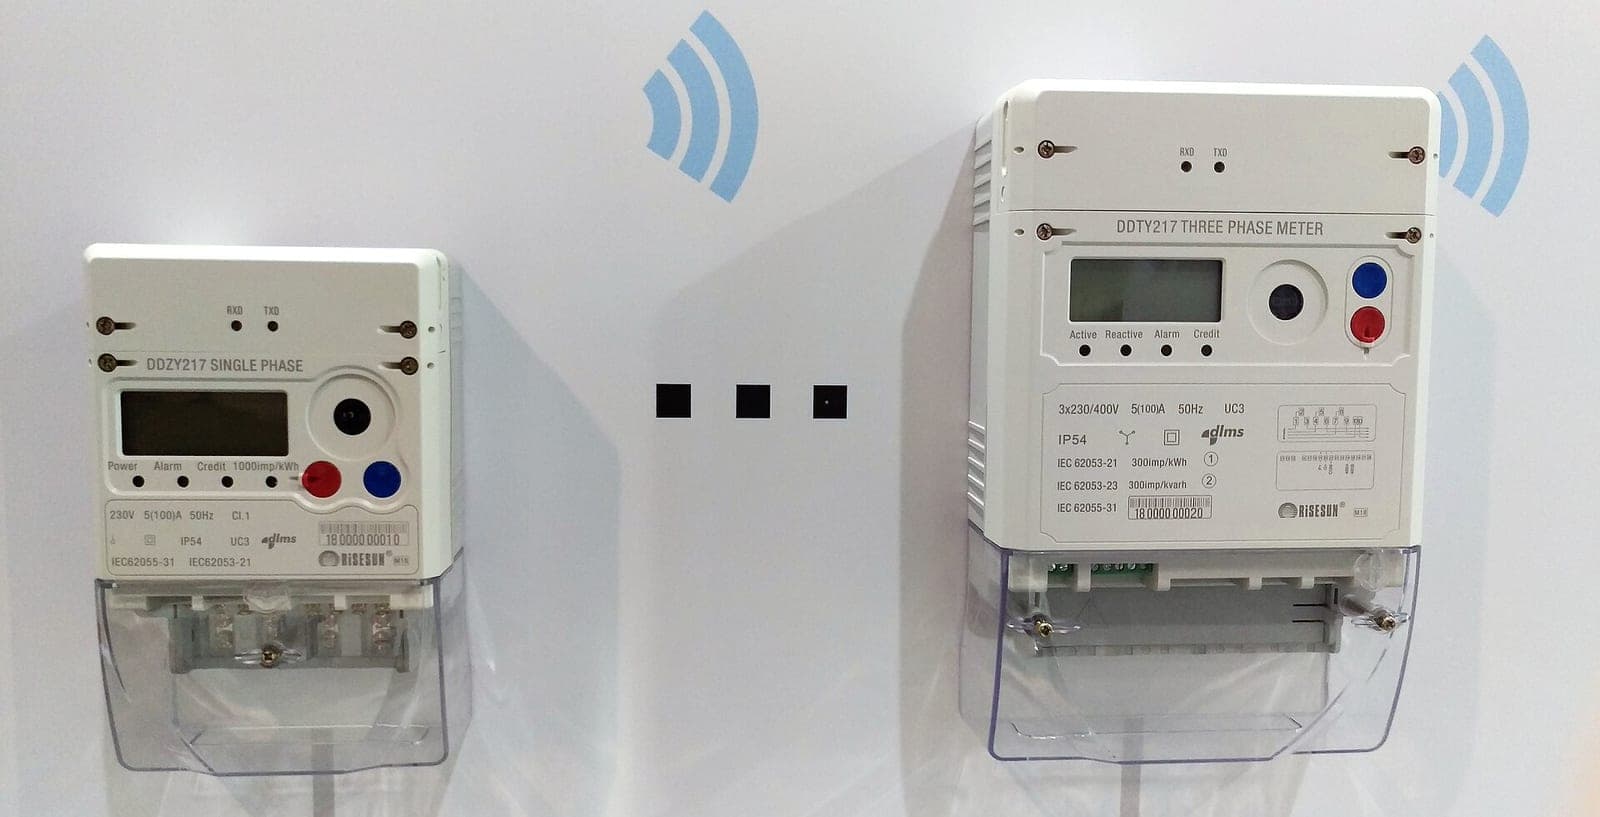
Smart meters and analyzers read consumption, a gateway carries the data to the platform, and the platform combines, calculates and reports. The same data supports daily monitoring and the periodic energy review.
- The main meter and sub-meters measure electricity, gas or water consumption.
- A gateway collects the data over Modbus or LoRaWAN.
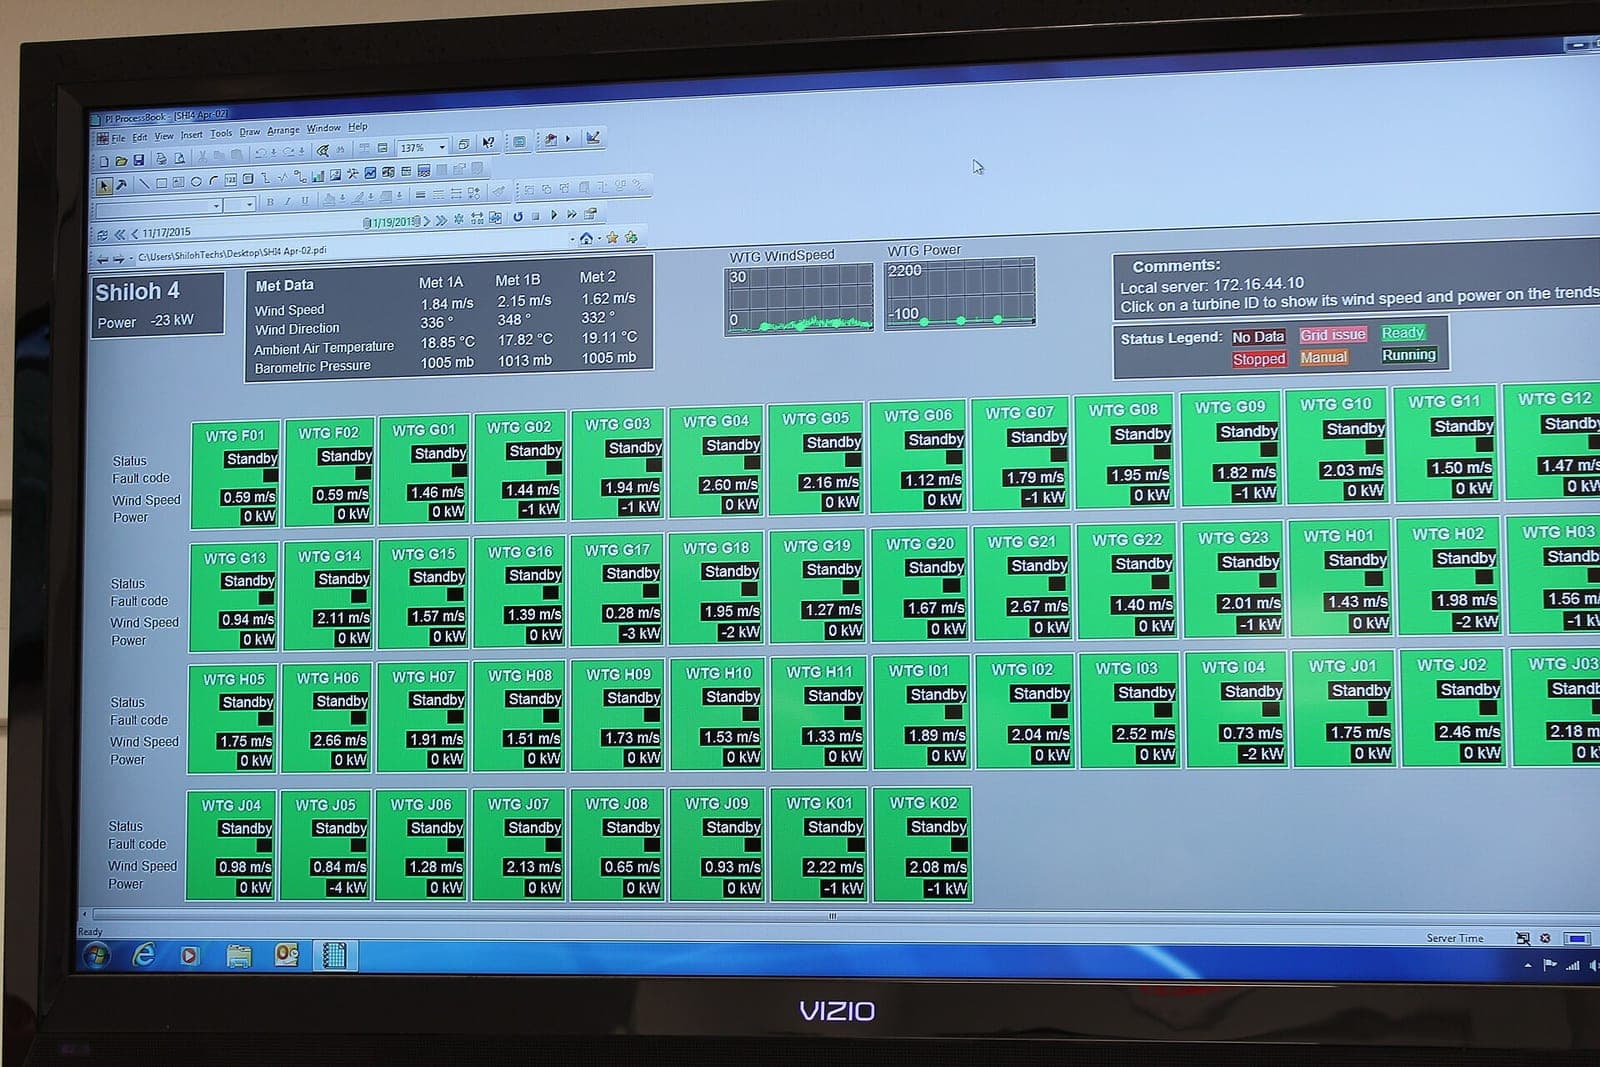
- The platform groups consumption by site, line and equipment, and stores it together with relevant variables such as production or weather.
- EnPI calculations, deviation alarms and periodic reports are produced.
Measurement interval and scope follow the measurement plan. First decide what must be measured, then which meter provides it.
Where does the measurement infrastructure fit in the standard?
- Energy review: energy sources and the distribution of consumption are established from measured data.
- Significant energy uses (SEUs): areas with high consumption or improvement potential are identified with data.
- Energy baseline (EnB): reference-period data is needed for comparison.
- Energy performance indicators (EnPIs): calculated from measured consumption and relevant variables.
- Measurement plan: defines what is measured, how often and with which device.
- Monitoring, measurement, analysis and evaluation: the check step of the PDCA cycle depends on this data.
Methods for setting up EnBs and EnPIs are covered in ISO 50006, and measurement and verification principles in ISO 50015. For Turkish regulation, the relevant legislation and official texts apply.
Which quantities are measured?
- Electricity consumption (kWh) and power (kW): show the distribution of consumption by main feed and sub-meter.
- Natural gas and heat consumption: track boilers, process lines and heating circuits.
- Water, steam and compressed air: make the energy load of utilities visible.
- Production volume, running hours and occupancy: used as relevant variables for EnPIs.
- Outdoor temperature: used to normalize heating and cooling consumption.
Which method or technology should be chosen?
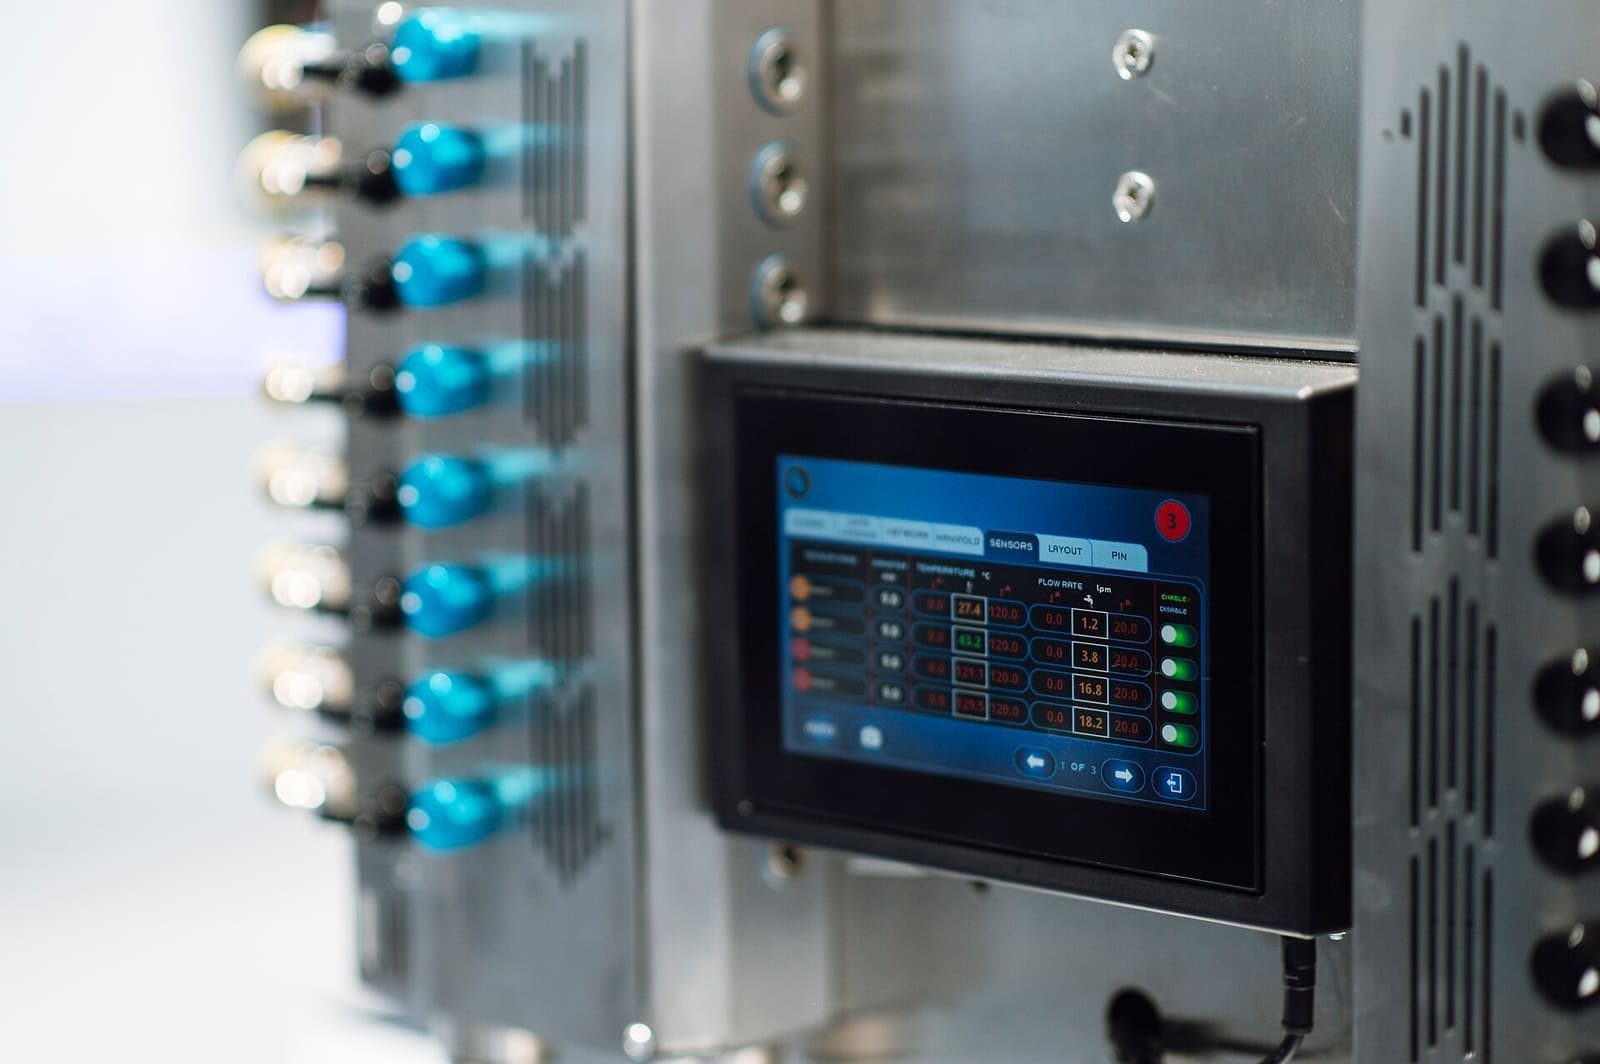
- Modbus RTU/TCP energy analyzer: reads power, energy and quality data at the panel; the device must support Modbus and provide a register map.
- Pulse-output meter: brings existing meters into the system; the pulse constant and input must be configured correctly.
- LoRaWAN smart meter and current sensor: adds sub-points without cabling; limited for measurements that need frequent sampling.
- Manual data entry: fills in items that cannot be measured; it adds delay and error risk, so automatic measurement is preferred where possible.
Who is it for?
- Industrial plants planning to implement ISO 50001
- Businesses with an energy manager or energy efficiency consultant
- Facilities that read many sub-meters by hand
- Large buildings such as shopping malls, hotels and hospitals
- Organizations that want to compare energy across several locations
How do alarms, notifications and integration with existing systems work?
An expected range is defined for each EnPI or measurement. If consumption leaves that range, the platform notifies the chosen channels (screen, email, message); the person in charge acknowledges the alarm and the event is logged.
If a meter or gateway connection drops, the platform shows the data gap. If the gateway keeps a local buffer, the data is transferred when the link returns; this depends on the chosen device and configuration.
Energy data can be passed to a building management system, SCADA software or reporting tools over interfaces such as Modbus, MQTT or an API. The connection to existing meters and software is adapted to your needs; the interface is decided during the site survey.
Data privacy and security
The system collects energy consumption and device status; collecting personal data is not its purpose. Users are authorized by role, and people who can view reports are separated from those who can change settings. Data retention and any KVKK assessment are handled with your own privacy notice and legal counsel.
Installation process and what a quote needs
First, a site survey reviews the existing meters, panels and energy sources, and the measurement plan shows which points are missing. A pilot follows in one building or line, the data is verified, and the rollout then extends to the other points.
For a quote, the number of points, energy types, existing meter and analyzer information and the site layout are enough. You can share them through the contact form.
To turn energy data into emissions, see carbon footprint monitoring; for a wireless sub-meter network, see the LoRaWAN sensor infrastructure.
Highlights
Energy distribution by sub-meter
Consumption is grouped by site, line and equipment, so SEU candidates become visible in the data.
Baseline and EnPI calculation
Reference-period data is stored and EnPIs are calculated with relevant variables for period comparison.
Deviation alarm
When consumption leaves the expected range, the person in charge is notified and the event is logged.
Modbus, pulse and LoRaWAN reading
Existing meters and new wireless points are combined on a single platform.
Periodic energy report
Consumption reports are prepared for the energy review and management meetings.