
What is energy SCADA and automation?
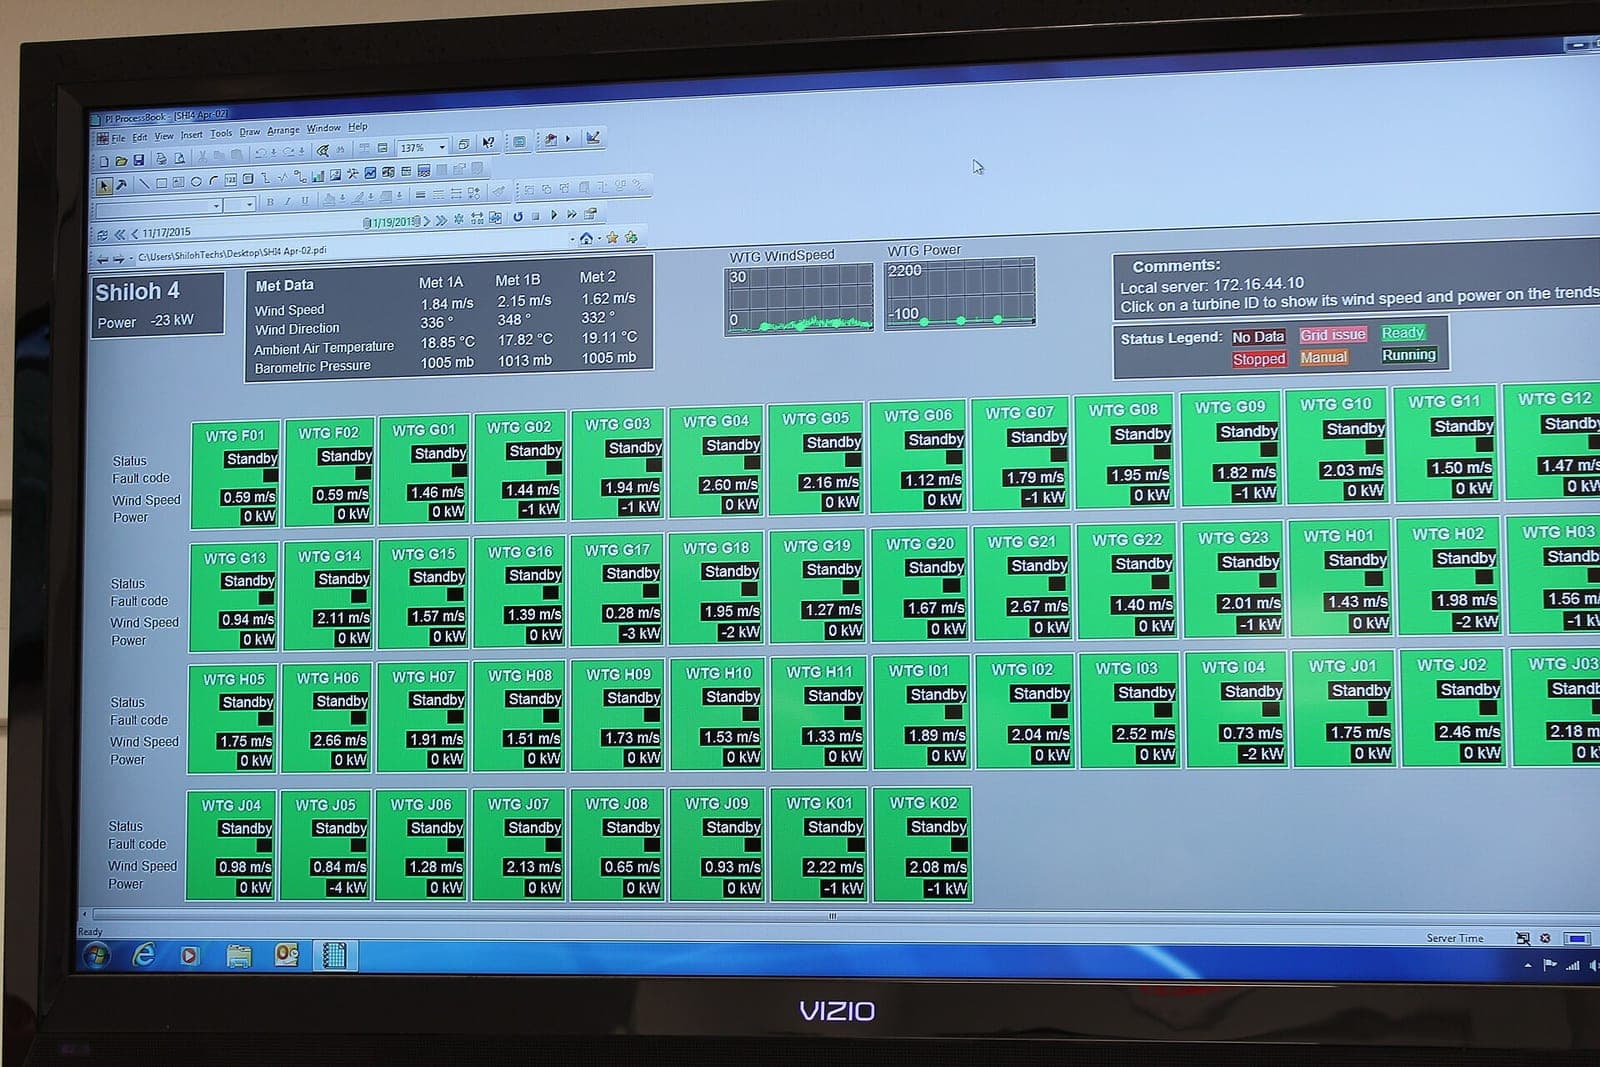
Energy SCADA and automation is a remote monitoring and control system. It reads electrical data from transformers, panels, generators and motor feeders through energy analysers and I/O modules, shows it on one screen, raises alarms on limit breaches and drives relay outputs by rule. The aim is to see and act on the plant energy state without going on site.
How does it work?
Field equipment reads the values, a gateway carries them to the platform, and the platform displays, stores and reacts to them by rule. A value in the panel reaches the operator screen within seconds.
- Energy analysers, current sensors and generator data produce the panel values.
- A gateway collects the data over Modbus or LoRaWAN.
- The platform shows it on one screen, keeps history and runs the alarm rules.
- An automation rule drives a relay output when needed; an event log and shift report are produced.
The measurement interval and alarm thresholds are set per point. That way slowly changing values such as transformer load and faster ones such as motor current can be read correctly on the same screen.
What quantities are measured?
- Line voltage and grid frequency: show supply quality and fluctuation.
- Total active power and demand: used to watch for approaching the contracted demand limit.
- Power factor and correction stages: track reactive power management.
- Motor current: shows load rises on compressor and pump feeders early.
- Transformer load and generator status: support backup power and capacity tracking.
Which method or technology should you choose?
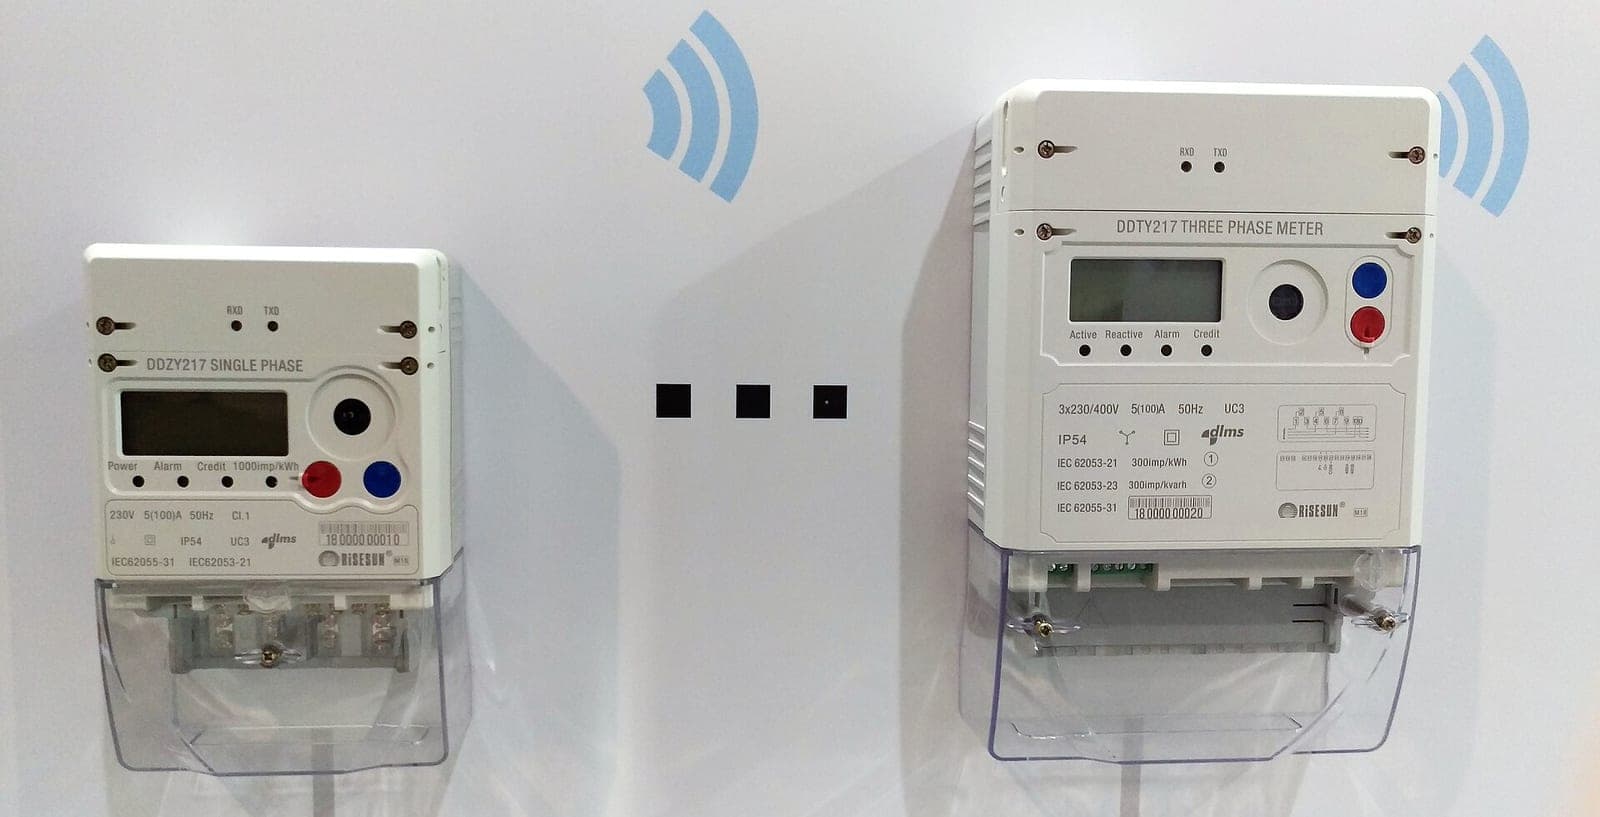
- Modbus RTU/TCP analyser reading: lets you reuse existing analysers; the device needs Modbus support and a register map.
- LoRaWAN sensors: measure current and status without cabling; not suited to fast control loops, so used mainly for monitoring.
- I/O module and relay: provide a control output; the safety conditions of the controlled load must be considered separately.
- Working alongside an existing PLC or SCADA: protects the investment; needs a data mapping effort.
Who is it for?
- Industrial plants with transformers and many panels
- Sites that need generator and backup power monitoring
- Manufacturers who want to manage their demand limit
- Organisations monitoring several locations from one place
- Renewable energy sites such as wind and solar
How do alarms and notifications work?
A threshold is set for each measurement. When a value crosses it, the platform raises an alarm and notifies the chosen channels (screen, e-mail, message). The operator acknowledges the alarm and the event log keeps a timestamped record.
If a link drops, the device or gateway reports it. If the gateway keeps a local buffer, data is sent to the platform once the link returns. This depends on the chosen devices and configuration.
Integration with existing systems
Energy data can be passed to other systems through interfaces such as Modbus, MQTT or an API. Links to an existing PLC, SCADA or building management system are adapted to the need, and the protocol to use is settled during the site survey.
Data privacy and security
The system collects electrical quantities and device status; collecting personal data is not its purpose. Users are authorised by role, and users who can send control commands can be restricted separately. Data retention and the data protection assessment are handled with the company own privacy notice and legal counsel.
Installation process and what a quote needs
A site survey first reviews the panels, analysers and communication infrastructure. A pilot then goes on one panel or feeder, screens and alarms are verified, and the rollout extends to other points.
For a quote, share the number of points to measure, existing analyser and PLC details, the outputs to control and the plant layout through the contact form.
If you only want to catch consumption deviations, see energy analysis and anomaly detection; for metering infrastructure and target tracking, see energy management.
Highlights
Transformer, panel and generator on one screen
Voltage, power, power factor and equipment status are followed on a single operator screen.
Demand limit alarm
When total power nears the set limit, the operator is warned and the event is recorded.
Rule-based relay output
Automation rules can switch off non-critical feeders under defined conditions.
Reading over Modbus and LoRaWAN
Existing analysers join over Modbus and wireless points join over LoRaWAN.
Shift energy report
The power curve and event log are collected in a shift or end-of-day report.