
What is carbon footprint monitoring?
Carbon footprint monitoring means measuring the activity data that emission calculations rely on (electricity, natural gas, fuel, vehicle kilometres), collecting it on a platform and making it reportable by GHG Protocol scope. Emissions equal activity data multiplied by an emission factor and are expressed in CO₂e. Verification is carried out by independent bodies.
How does it work?
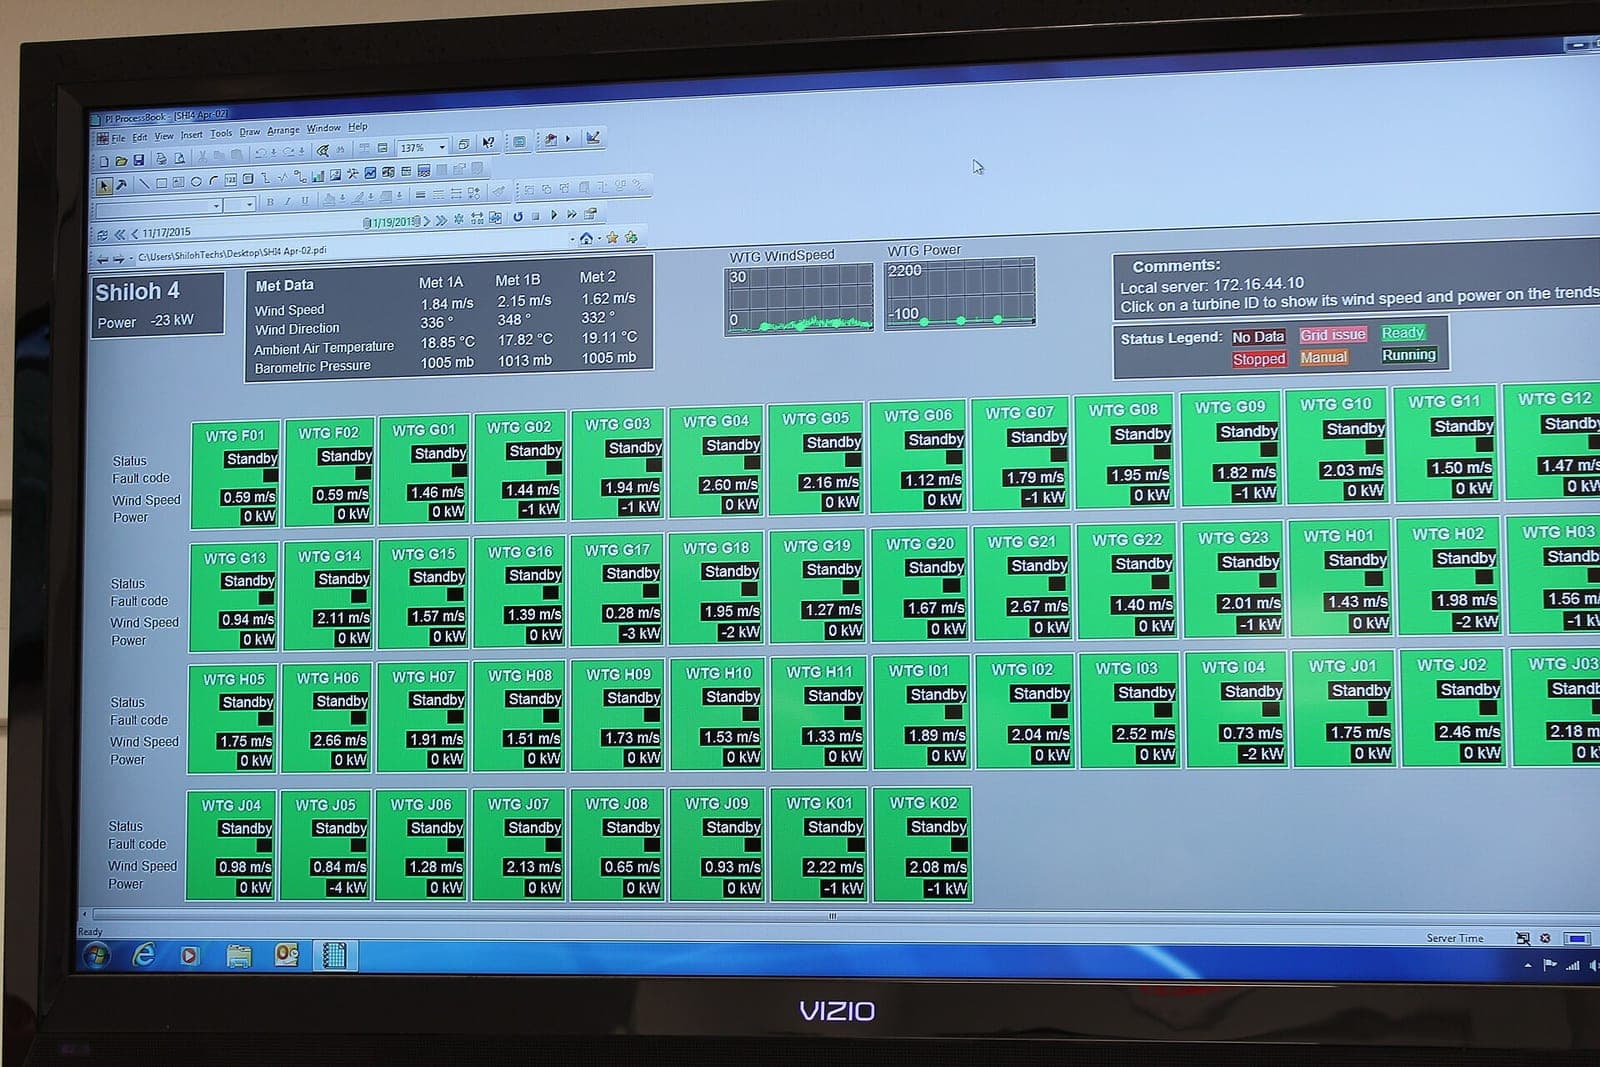
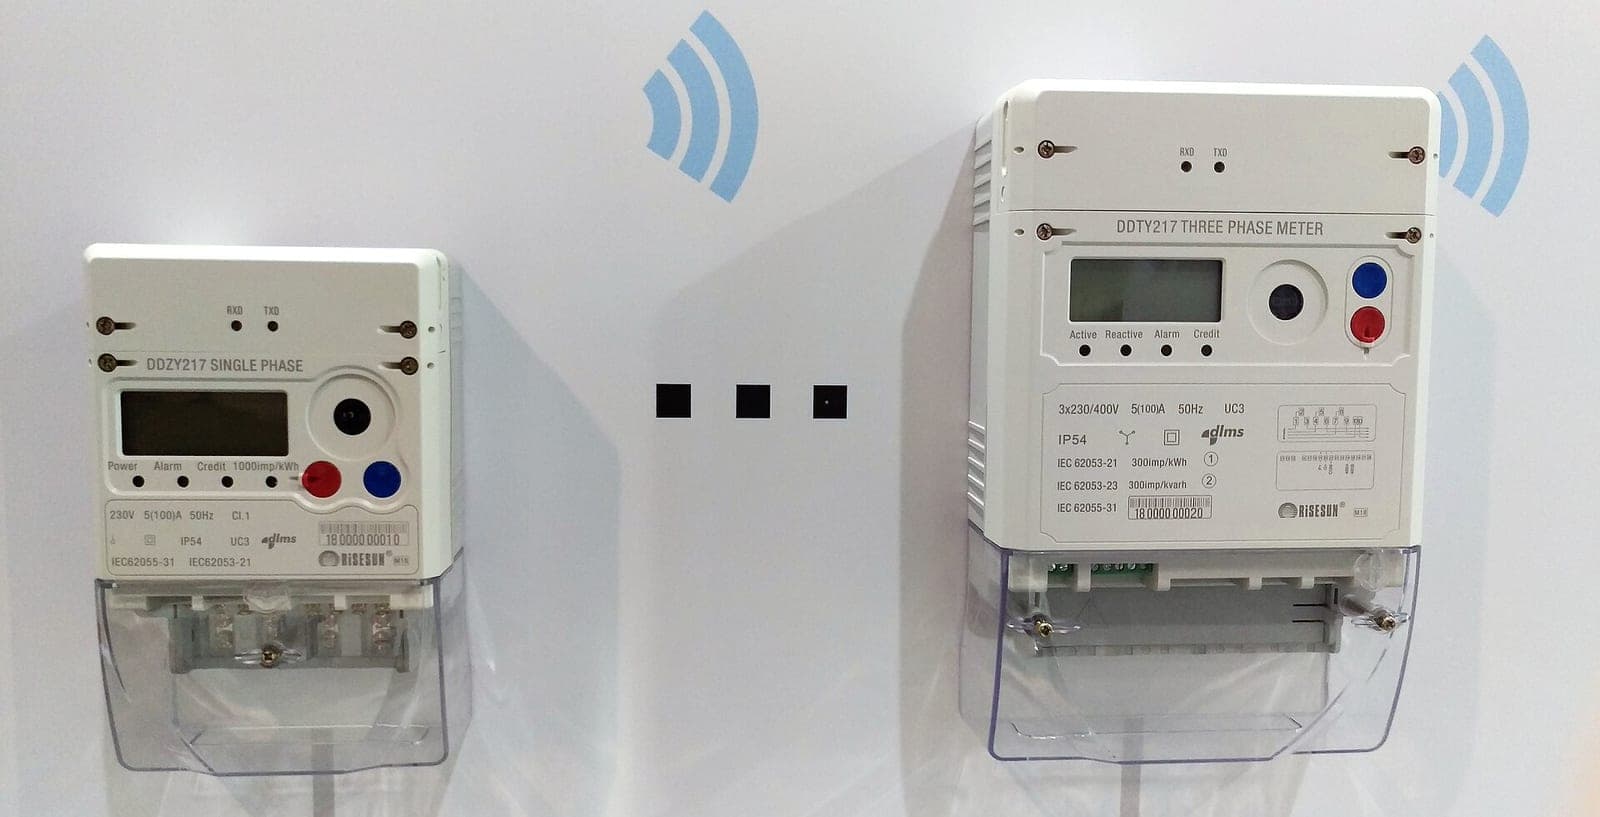
Meters and sensors measure consumption, a gateway carries the data to the platform, and the platform splits the activity data by scope and converts it to emissions with the calculation rule. The more the data rests on measurement, the more traceable the result.
- Electricity, gas and fuel meters plus vehicle data provide the activity data.
- A gateway collects the data over Modbus or LoRaWAN.
- The platform groups data by site, source and scope.
- Emissions = activity data × emission factor; current official emission factors are used.
- A periodic report and a breakdown by source are prepared.
Calculation rules are adapted to your needs. Which factor and approach to use depends on the corporate inventory method and the official texts in force.
What data do Scope 1, 2 and 3 need?
- Scope 1 (direct): natural gas and fuel burned in boilers and processes, company vehicles, refrigerant leaks.
- Scope 2 (indirect energy): purchased electricity, heat and steam; location-based and market-based approaches can be reported separately.
- Scope 3 (value chain): purchased goods and services, transport, business travel and similar items; often based on supplier and invoice data.
Measurement infrastructure helps most for Scope 1 and Scope 2. Most Scope 3 data is not measured on site and is gathered from other sources.
Which quantities are measured?
- Electricity consumption (kWh): the main input for Scope 2.
- Natural gas consumption: the input for Scope 1 combustion emissions.
- Fuel use and vehicle kilometres: used to calculate emissions of company vehicles.
- Production volume: used for intensity indicators such as emissions per product.
- On-site renewable generation: separates grid-drawn energy from energy generated on site.
Which method or technology should be chosen?
- Meter-based measurement: the most traceable method; it requires meter investment and maintenance.
- Invoice data: gives a quick start; it stays at monthly resolution and shows deviations late.
- Vehicle tracking data: gives kilometres and fuel use per vehicle; the data source and driver information need separate care.
- Estimation-based calculation: fills items that cannot be measured; uncertainty is higher and the basis must be documented.
Who is it for?
- Industrial and service businesses preparing a corporate carbon inventory
- Manufacturers exporting to the EU whose customers ask for emission data
- Organizations preparing a sustainability report
- Facilities managing energy efficiency and emission targets together
- Groups that want to compare emissions across several locations
The EU Carbon Border Adjustment Mechanism (CBAM) can affect exporters. For scope, dates and obligations, refer to the current official texts and your advisor.
How do alarms, notifications and integration with existing systems work?
A period target or an expected range is defined for consumption or emissions. If a value leaves the range, the platform notifies the chosen channels (screen, email, message); the person in charge acknowledges it and the event is logged.
If a meter or gateway connection drops, the platform shows the data gap, and the gap should be stated clearly in the report. A gateway with a local buffer transfers the data when the link returns; this depends on the device and configuration.
Activity data can be passed to sustainability software, an ERP or reporting tools over interfaces such as Modbus, MQTT or an API. The connection to existing systems and the calculation rules are adapted to your needs; details are set during the site survey.
Data privacy and security
The system collects energy, fuel and vehicle usage data. In vehicle tracking, location data that can be linked to a driver may be personal data; whether to collect it, and the notice and legal assessment, are up to your company. Access is authorized by role; any KVKK assessment is handled with your own privacy notice and legal counsel.
Installation process and what a quote needs
First, a site survey reviews the inventory boundary, existing meters and data sources. A pilot follows at one site or source group, the calculation rules and reports are verified, and the rollout extends afterwards.
For a quote, the number of sources and points, existing meter and invoice data, the number of vehicles and your reporting expectations are enough. You can share them through the contact form.
For a solution focused on measuring energy data, see the ISO 50001 energy monitoring page.
Highlights
Automatic activity data collection
Electricity, gas and fuel data is read from meters, which reduces manual entry and repetition.
Grouping by scope
Data is split into Scope 1, 2 and 3 items so the breakdown by source is visible.
Activity data × emission factor calculation
The calculation rule is set to your needs, using current official emission factors.
Target and deviation notification
The person in charge is notified when data deviates from the period target or expected range.
Periodic emission report
A CO₂e report by site and source feeds the inventory and sustainability work.