
What is energy analysis and anomaly detection?
Energy analysis and anomaly detection is a software layer that continuously measures the electricity use of load groups, compares it with past behaviour, turns deviation from the expected into a score and warns when something is out of the ordinary. The aim is to notice a problem with equipment or a load group before the bill arrives.
How does it work?
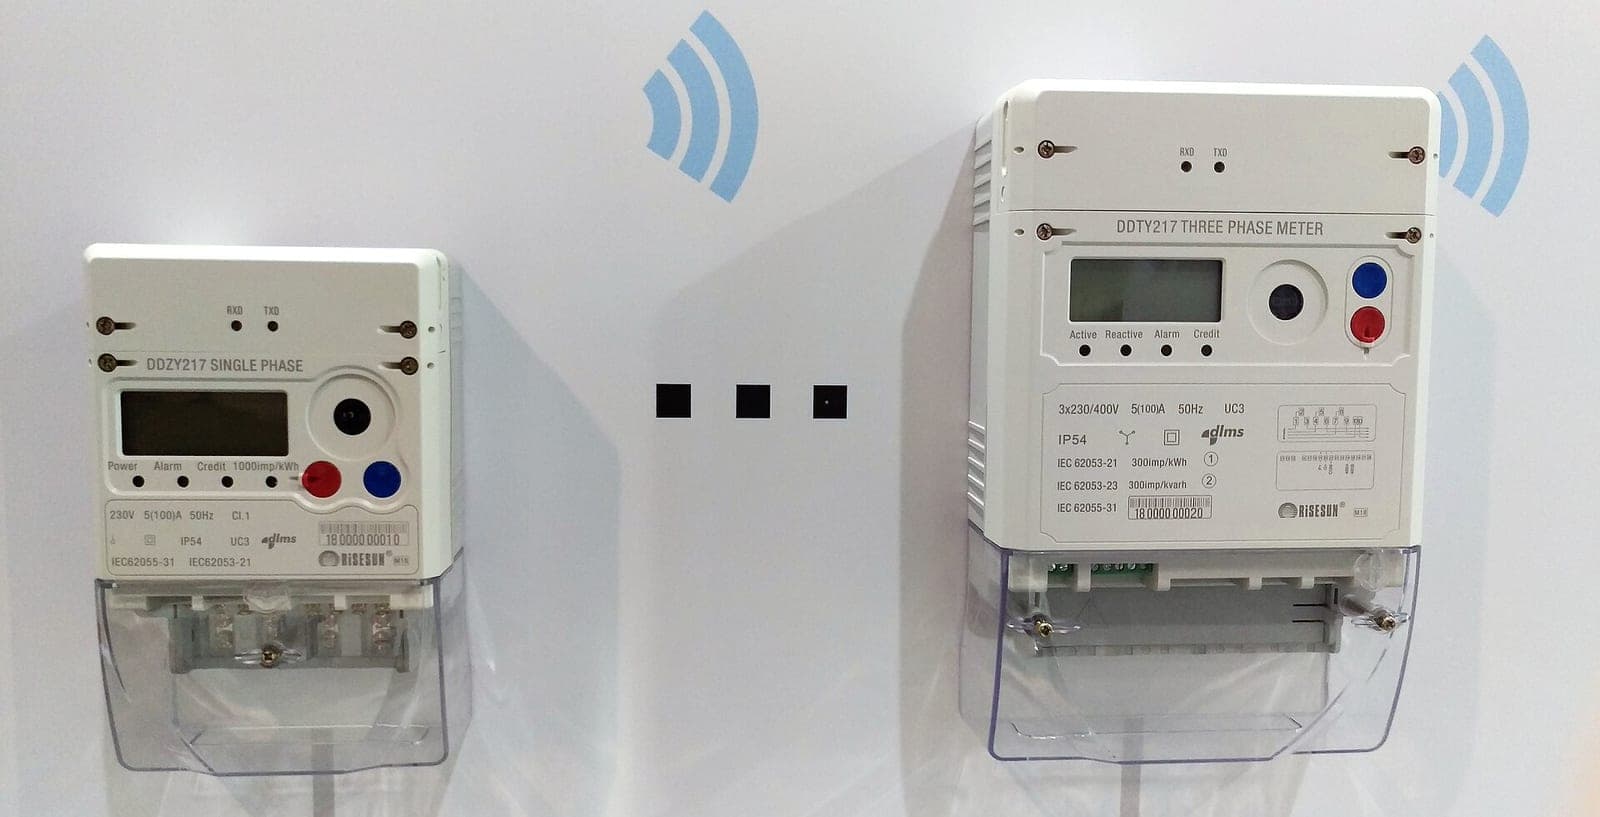
Current sensors and smart plugs measure the load groups. The platform calculates expected consumption from past data for the same hour and day type and compares it with the measured value.
- Sensors measure power at regular intervals.
- A gateway carries the data to the platform.
- The platform derives expected consumption and turns the deviation into an anomaly score.
- When the score rises, an alert is sent; the deviation analysis is added to the weekly report.
The expected profile is not fixed; it is recalculated as shifts, weekends and seasons change. That way a normal change does not raise an alarm every time and a real deviation stands out.
What quantities are measured?
- Current power and consumption (kWh): the base analysis data.
- Load group power: separates groups such as chiller, compressor, ventilation and lines.
- Night base load: shows what keeps running when production stops.
- Measured minus expected power: the basis of the anomaly score.
- Day type and hour: separates weekdays, weekends and shifts.
Which method or technology should you choose?
- Fixed threshold alarm: easy to set up; can raise false alarms when the load changes over time.
- Expected profile by hour and day type: more meaningful with variable loads; needs enough history.
- Anomaly score: ranks deviation as one number; what the model has learned still needs explaining.
- AI-assisted report: summarises findings; the energy manager makes the final decision.
Who is it for?
- Sites with heavy chiller, compressor and ventilation loads
- Manufacturers who want to compare the energy behaviour of production lines
- Managers looking for wasted consumption at night and at weekends
- Facility teams that want an early signal for maintenance
How do alarms and notifications work?
When the anomaly score passes a set level, the platform raises an alert and sends it to chosen channels such as e-mail or message. The alert shows the load group with its measured and expected power.
The alert is acknowledged and added to the event log. If a link drops, the gap is flagged so missing data is not read as a deviation; this depends on the configuration.
Alerts need not always go to the same person. Rules can be set so a chiller deviation reaches the maintenance team and a night base load rise reaches the energy manager.
Integration with existing systems
Analysis can take data from existing meters, analysers or SCADA over Modbus, MQTT or an API. Reports and alerts can be passed to other systems. Integration is adapted to the need and settled during the survey.
Data privacy and security
Analysis rests on the electrical data of load groups and needs no person-level data. Access is limited by role. Retention periods and the data protection assessment are handled with the company own privacy notice and legal counsel.
Installation process and what a quote needs
A survey lists the load groups and existing metering points. In a pilot a few groups are measured and the model settles as history builds; then other groups follow.
For a quote, share the number of load groups, existing meters and sensors, the communication situation and the reporting you expect through the contact form.
For live monitoring and relay control, see energy SCADA and automation; for a metering base focused on targets and reports, see energy management.
Highlights
Expected and measured power side by side
Expected consumption is derived from past data for the same hour and day type and shown with the measured value.
Anomaly score per load group
Deviation for each group, such as chiller, compressor or line, is ranked with a single score.
Night base load tracking
Load that continues when production stops is watched, so idle equipment becomes visible.
Deviation alert
When the score passes the set level, the right people are alerted and the event is recorded.
AI-assisted weekly report
Findings are summarised into a readable report for maintenance and energy teams.