
What is a smart factory (MES) system?
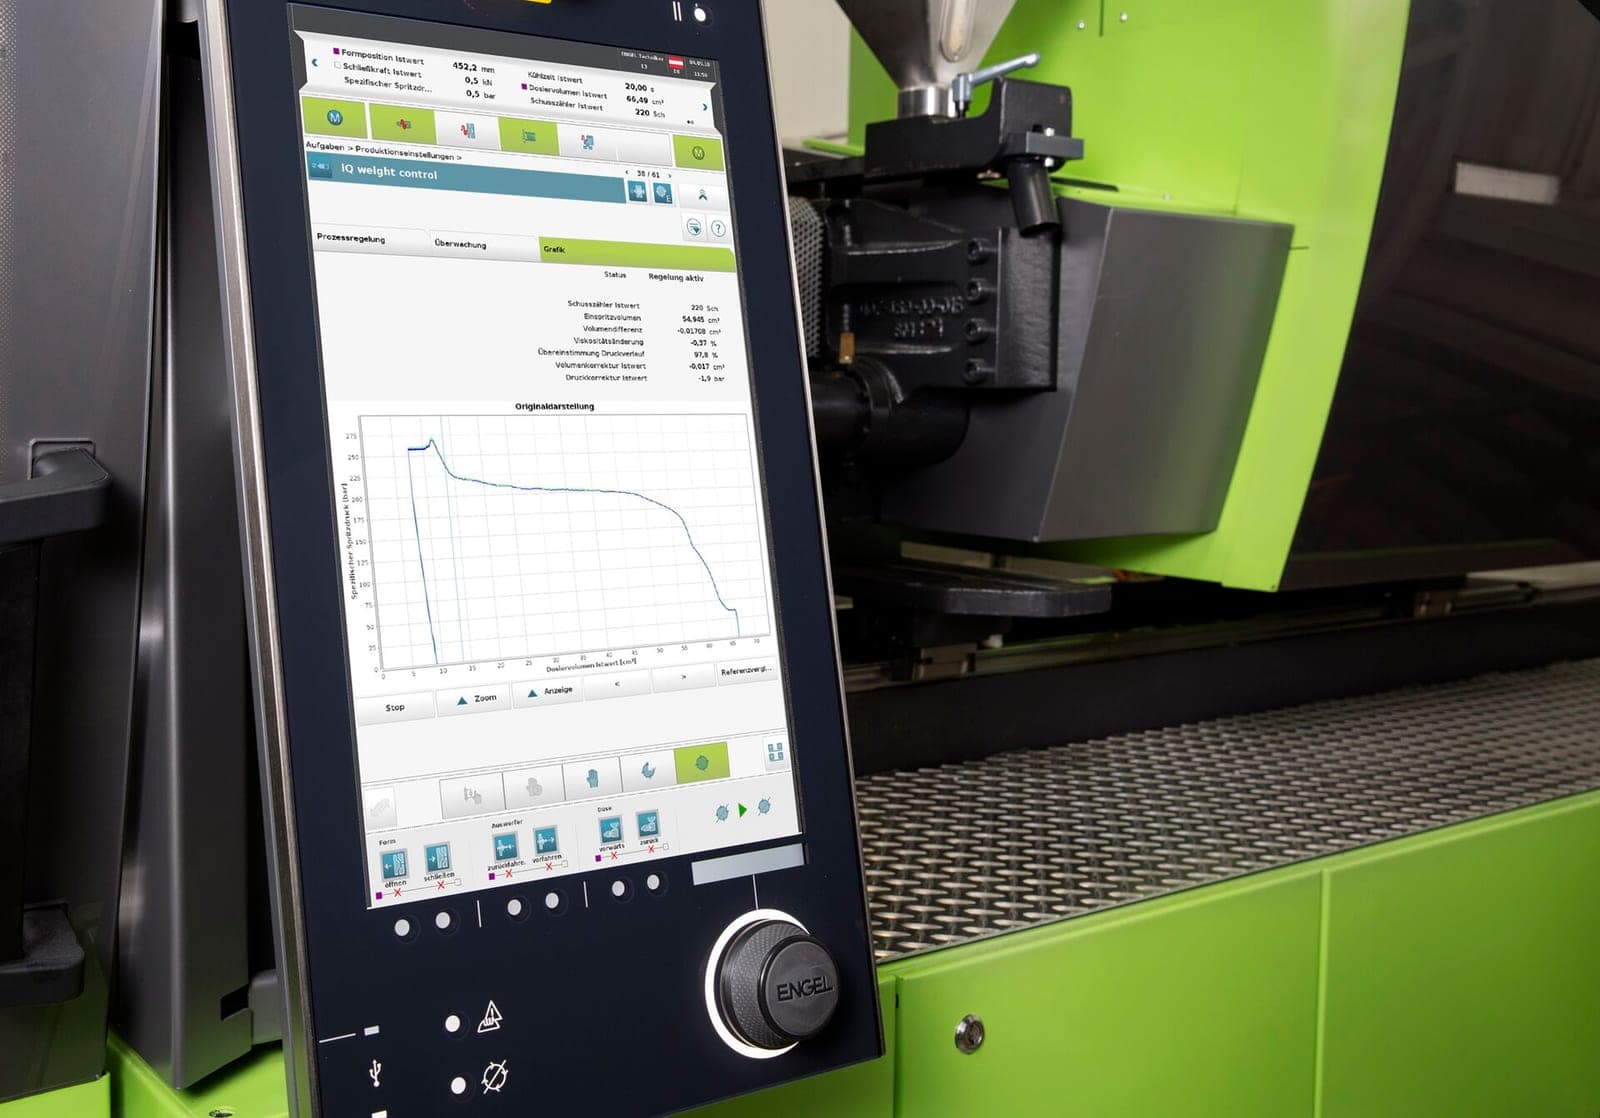
A smart factory (MES) system collects sensor and counter data from production machines and shows downtime, output and performance in real time. The goal is to see the state of the line without waiting for the end of the shift, and to calculate indicators such as OEE from data instead of manual notes.
MES software does not do the same job as ERP. ERP plans orders, stock and cost, while MES tracks what is happening on the shop floor right now. The two complement each other.
How does it work?
Sensors fitted to a machine or line send data to a gateway, and the gateway forwards it to the platform. The platform processes the data per machine and shift, shows it on a dashboard, raises an alarm when a threshold is crossed and writes it to a report.
- Sensor: machine run state, temperature, vibration, counter pulse.
- Gateway: collects data from field devices and passes it to the platform.
- Platform: calculates downtime reasons, output and OEE.
- Output: live dashboard, alarm notification and shift report.
Which quantities are measured?
- Machine state (running, idle, faulted): to work out downtime and its frequency.
- Production counter: for output and line speed.
- Motor and bearing temperature: to catch overheating before a failure.
- Vibration: to watch for imbalance and wear.
- Energy use: to see consumption per machine and line.
- Rejected units: for the quality part of OEE.
How is OEE tracked, and which method fits?
OEE is the product of availability, performance and quality. An OEE tracking system calculates these three from machine data. There are several ways to collect that data.
- Manual logging: easy to start, but delayed and error-prone; downtime reasons are often forgotten.
- Reading from the machine controller (PLC): rich data, but each machine needs connection and protocol work.
- External sensors and counters: work on older machines without touching them; the data is limited to what the sensor sees.
- Mixed setup: read the controller on new machines and use sensors on old ones.
Who is it for?
- Plastics, metal and food plants running serial production.
- Sites with machines of mixed ages that want to monitor them without replacing everything.
- Production and maintenance managers who want to see downtime reasons and shift differences.
- Plants that want to separate energy use by line.
How do alarms and notifications work?
Alarm thresholds are set for your process. When one is crossed, the platform notifies the right person through the chosen channel, the person acknowledges it and the event is logged. You can later see when a stop began, who saw it and how long it lasted.
If the network connection drops, device behaviour depends on the hardware used; the details are settled during the site survey.
Integration with existing systems
Data usually comes in over industrial protocols such as Modbus or OPC UA, over MQTT or through an API. Which interface is used is adapted to your machines, ERP software and needs. Pulling order and work-order information from ERP can be part of the same work.
Data privacy and security
The system collects machine and process data; collecting personal data about employees is not its default purpose. Access is limited through role-based permissions. If any use involves personal data, the data-protection assessment is made with your own privacy notice and legal counsel.
Installation and what we need for a quote
The process starts with a survey: we walk the line and agree on the machines to monitor and the indicators to track. A pilot follows on one line or a few machines, the data is verified, and then it is rolled out to other lines.
For a quote we need the number of machines, the quantities to monitor, the age and controller type of the machines, and your current ERP or software setup. You can reach us through the contact form.
Highlights
Live production dashboard
Machine state, output and downtime are visible in one dashboard in real time.
OEE from data
Availability, performance and quality are calculated from machine data, so manual logging is not needed.
Downtime reason log
The start, duration and reason of each stop are recorded and compared by shift and machine.
Works with older machines
Machines without a controller can be monitored with external sensors and counters.
Alarms and reports
Threshold breaches are notified, events are logged and a shift report is produced.