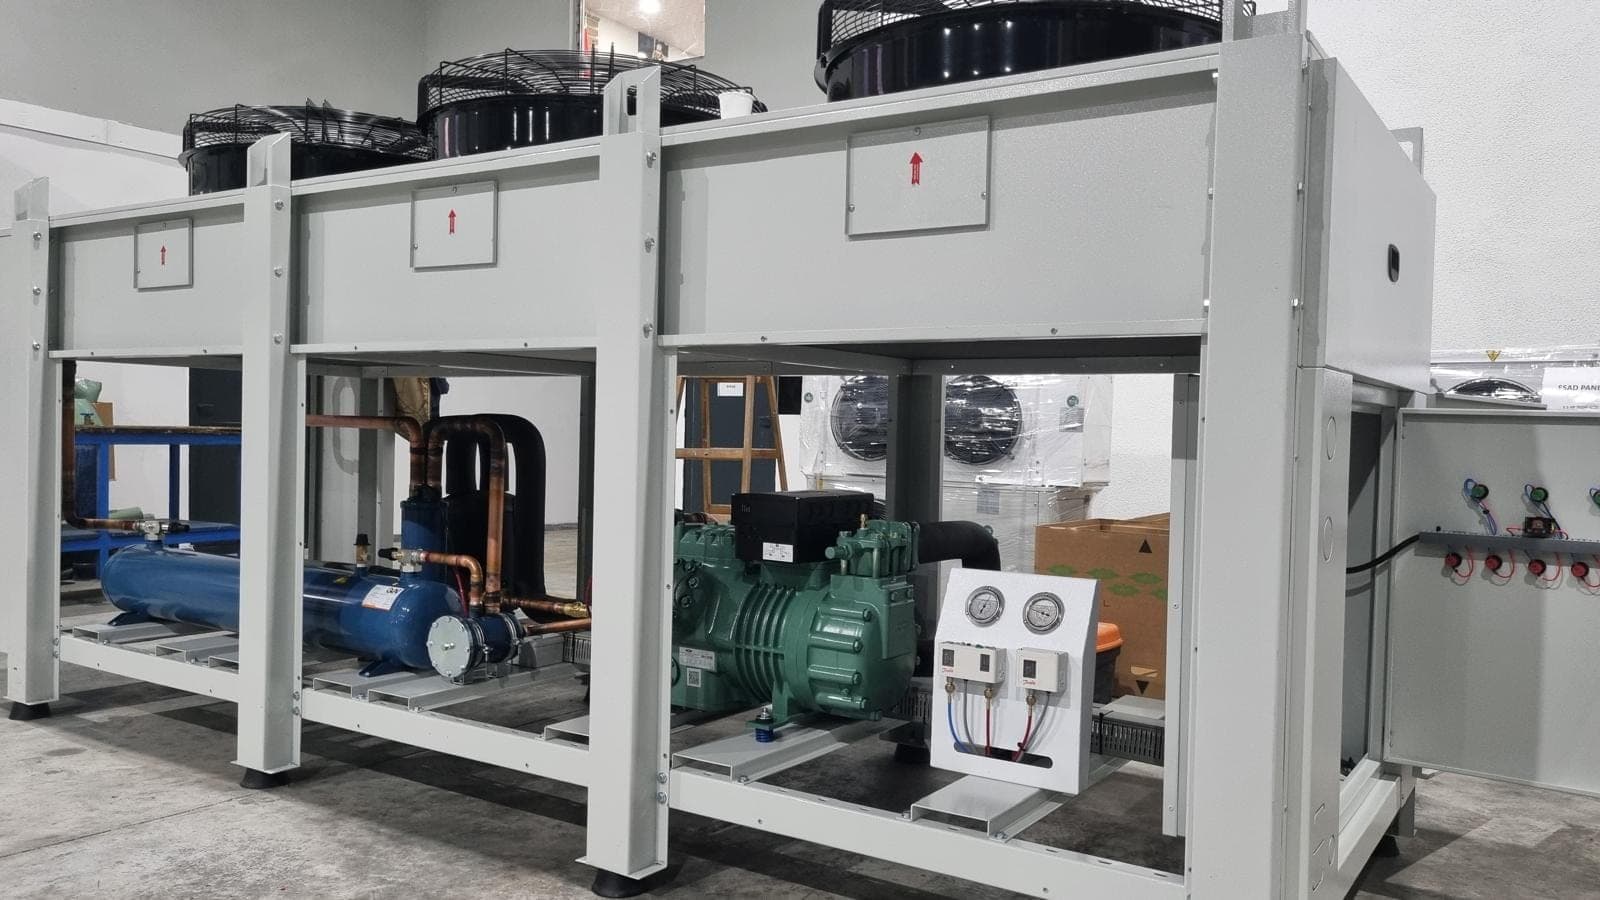

What is warehouse temperature mapping? How is it done?
Warehouse temperature mapping measures temperature and humidity over time with sensors placed at different points, to find hot and cold spots. The results guide where permanent monitoring sensors should go.
Request a demoRenokta Ekibi ·
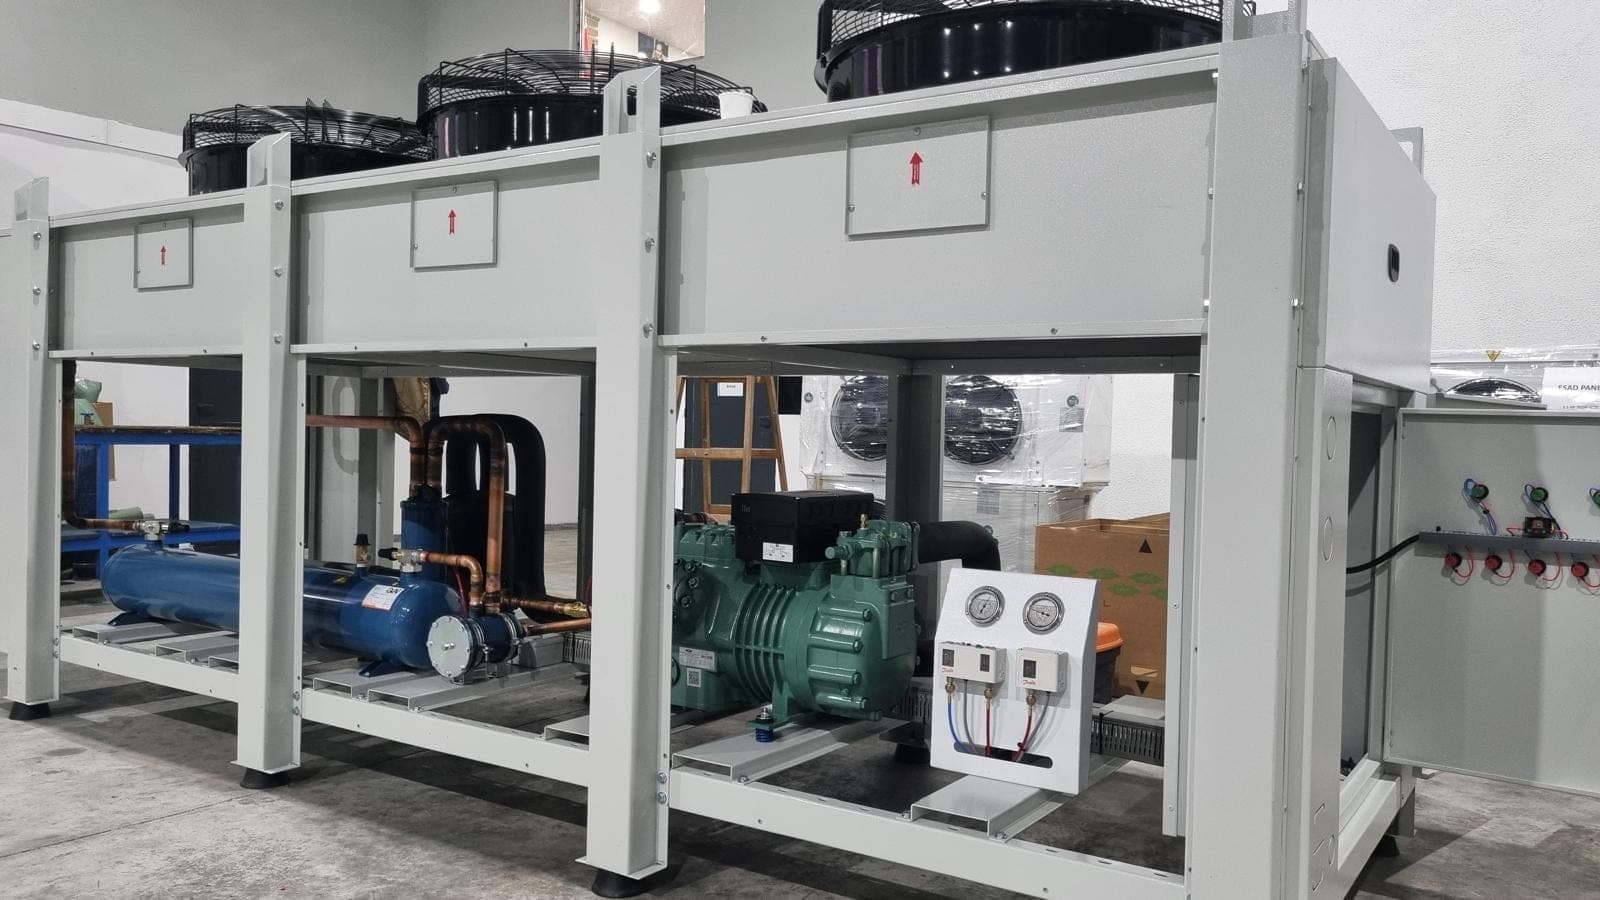
- 1. Place sensorsSensors go at corners, the door, the supply point and different heights.
- 2. Collect recordsTemperature and humidity are recorded through day and night.
- 3. Find the spotsThe hottest and coldest positions are found from the data.
- 4. Set up permanent monitoringPermanent sensors are installed at the chosen points.
- 5. Alarm and reportThreshold breaches raise alerts and history is kept.
Warehouse temperature mapping means collecting temperature and humidity data for a set period with sensors placed at many points, to find where the space runs warm or cold. The result is used to decide where continuous monitoring sensors should be installed.
Why is mapping needed?
Temperature is not the same everywhere in a warehouse. Areas near doors, shelves close to the roof, the cooling supply point and spots next to heat sources behave differently from the centre. A single sensor does not show these differences, and the product sits on its shelf, not where the sensor happens to be.
Mapping turns that difference into data. Risky zones are known in advance, and product placement or the cooling layout can be reviewed accordingly.
Mapping also tests whether the cooling equipment is adequate. If it cools one zone well and leaves another short, that difference only shows up with multi-point measurement. How long the temperature takes to return to its previous value after the door closes can be read from the same data.
Where should sensors be placed?
Placement is planned according to the volume and airflow of the warehouse. The main principle is to put sensors at different heights and positions so that the extremes and the airflow are represented.
- Corners and wall edges: the areas most affected by outside conditions.
- Door and loading area: temperature shifts as the door opens and closes.
- Cooler or air-conditioning supply point: often the coldest zone.
- Upper shelves and under the ceiling: warm air collects at the top.
- Areas near the floor: cold air may settle low.
- The centre of the warehouse: shows the average behaviour.
How are hot and cold spots found?
Hot and cold spots are the positions that show the highest and lowest values during the recording period. The data of each sensor is compared as a time series, and a sensor that keeps deviating from the others marks a spot.
A short recording is not enough. Day and night, busy and quiet door traffic and, where possible, different seasons should be observed. Duration and threshold values are set according to product requirements and the relevant guidelines.
Take a fictional example: if a sensor on an upper shelf keeps reading higher than the others all day, that shelf is a candidate hot spot. If the same sensor rises only while the door is open, the problem lies more in door traffic than in the shelf position. That distinction changes the measure to take.
Why is humidity measured too?
For many products humidity matters as much as temperature. High humidity can spoil packaging and raise the risk of mould, while very low humidity can cause drying and static problems. Measuring both together also allows condensation risk to be assessed.
For this reason most sensors used in mapping record both values. The storage range for each product comes from the manufacturer label and the relevant sources.
Sensor calibration also matters for reliable measurement. Sensors should be compared with a reference before recording, and the report should note which device was checked and when. Otherwise it is impossible to tell whether a deviation comes from the environment or from the device.
How is continuous monitoring set up after mapping?
Mapping results decide where the permanent monitoring sensors go. One sensor is placed at each hot and cold spot, plus a few representative points, and the data is sent through a gateway to a platform.
Wireless sensors make this stage easier: they install without cabling and can be moved when the shelf layout changes. Because metal racks and cold room walls can weaken the signal, the gateway position should also be tested before installation.
- Threshold definition: lower and upper limits per product.
- Delayed alarm: reduces needless alerts for brief deviations such as a door opening.
- History: deviations stored together with their time.
- Periodic review: repeat the mapping when the shelf layout or equipment changes.
Regulations and quality systems
In food, pharmaceutical and similar sectors, rules may apply to temperature control and its records. Current legislation and official texts should be followed here, and the way mapping results are reported also depends on those texts and on the quality system.
Conclusion
Mapping makes the distribution of temperature and humidity in a warehouse visible and ensures that continuous monitoring sensors go in the right places. You can review our cold chain storage solution page or request a needs discovery for your warehouse.
Frequently asked questions
- How long does temperature mapping take?
- The duration is not fixed. It should be long enough to cover the day-night cycle and busy and quiet hours. For an exact period, follow product requirements and the relevant guidelines.
- How many sensors are needed?
- The number depends on the volume, shelf layout and airflow of the warehouse. They are spread so that corners, the door, the supply point, upper and lower shelves and the centre are represented.
- What is a hot spot?
- A hot spot is the position that shows the highest temperature during the recording. It is usually found under the ceiling, next to heat sources or in areas with weak airflow.
- Can mapping be done once and left?
- Usually not. When the shelf layout, equipment or use changes, the distribution changes too, and the mapping needs to be repeated.
- Does mapping replace continuous monitoring?
- No. Mapping shows one period in time, while continuous monitoring catches a deviation immediately. The two complement each other.