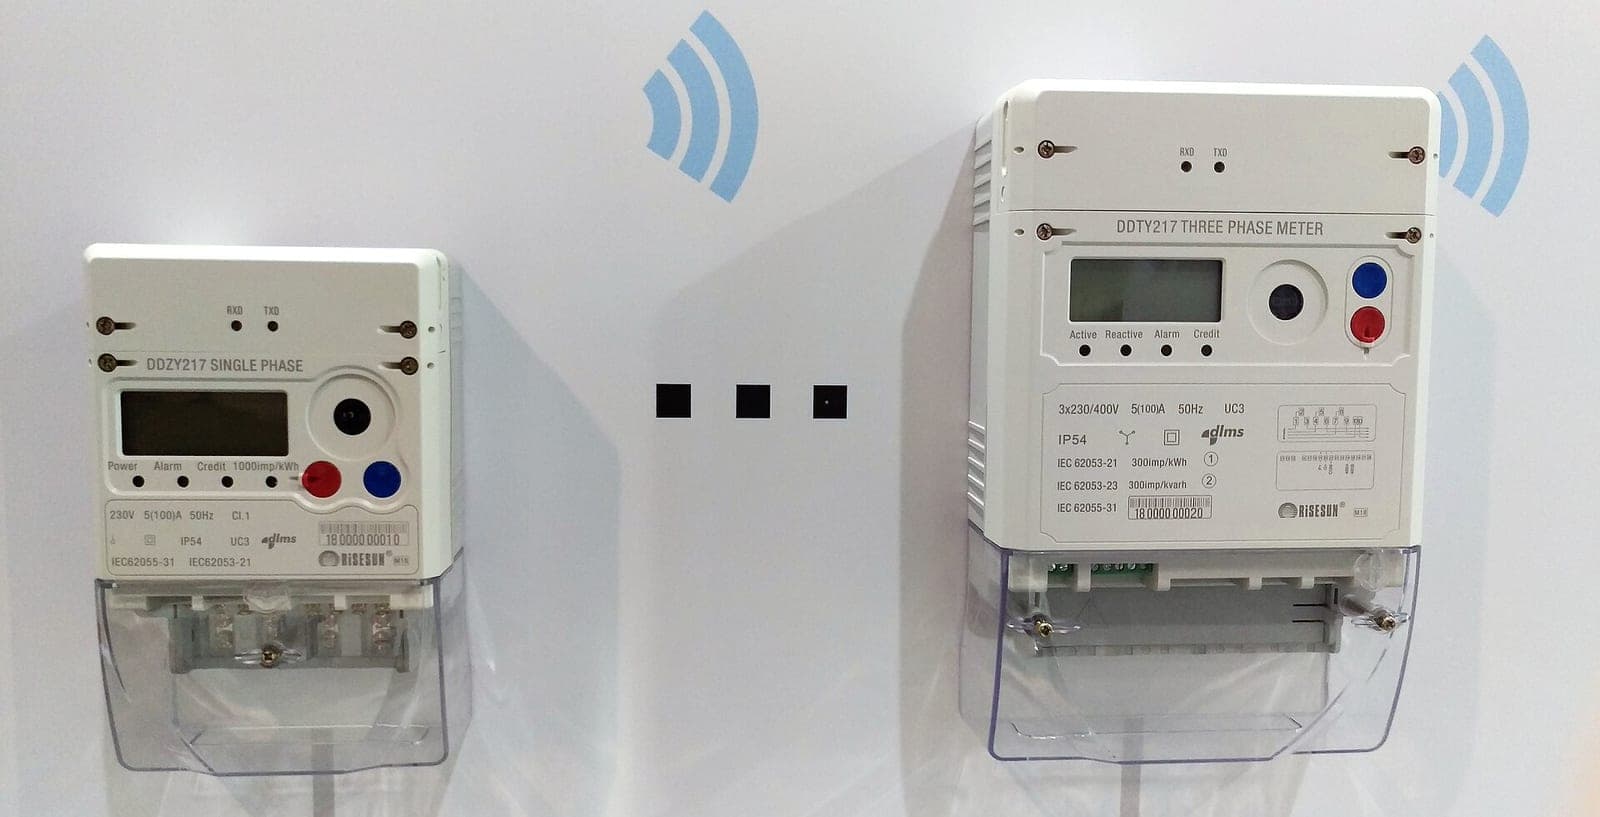

Monitoring energy use and detecting anomalies
Saving energy starts with measuring. Current measurement on mains and sub-circuits, a normal-use baseline and rules that catch deviations show waste and faults early.
Request a demoRenokta Ekibi ·
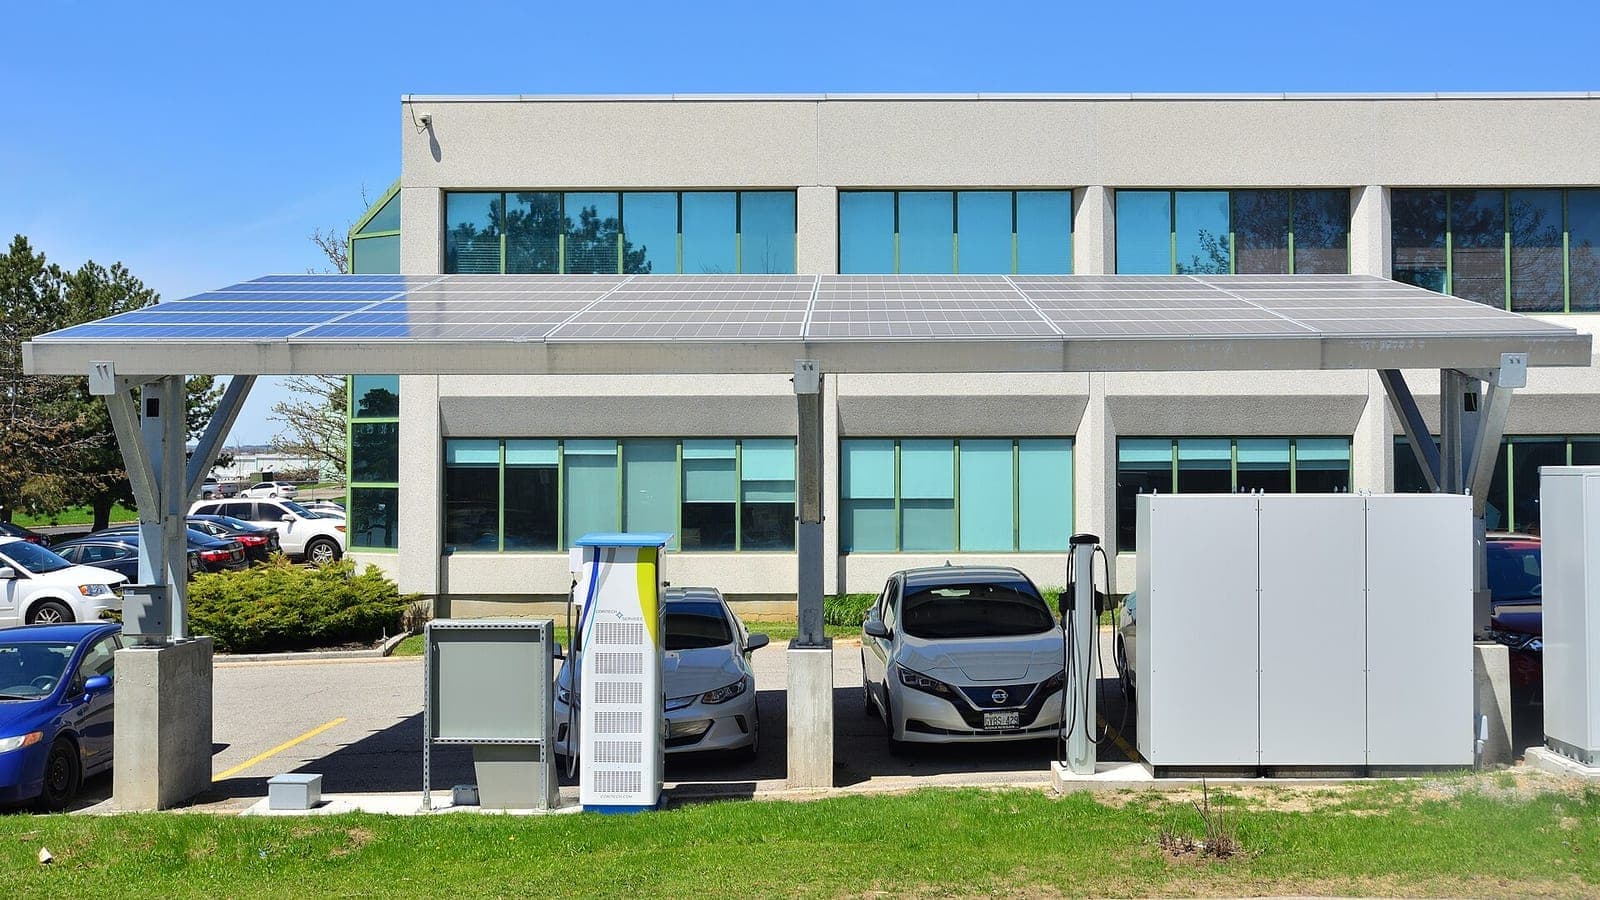
- 1. Measuring pointsThe main incomer, big sub-circuits and key equipment are chosen.
- 2. Current measurementClamp-on transformers send readings wirelessly.
- 3. Normal baselineA few weeks of data give a curve by day and hour.
- 4. Deviation rulesA clear deviation from the baseline is flagged as an anomaly.
- 5. Alarm and reportAnomalies are notified and consumption feeds the carbon report.
Energy monitoring means measuring current on the mains and sub-circuits continuously and catching deviations from a normal-use baseline as anomalies. On the monthly bill you see one number; you cannot see which circuit used how much and when. Sub-metering and time series fix that blindness.
What should you measure when monitoring energy?
Measure the main incomer, the big sub-circuits and key equipment.
- Main incomer: total consumption and power.
- Sub-circuits: big loads such as lighting, HVAC, production lines and refrigeration.
- Key equipment: a compressor, pump or oven that takes a large share on its own.
What is a current transformer and how is it used?
A clamp-on current transformer is a sensor that fits around a conductor without cutting it and measures current. Wireless models send data over a network such as LoRaWAN. Working inside a panel is risky; installation must always be done by qualified electrical staff.
How do you find the normal-use baseline?
The baseline is a typical consumption curve for a circuit, built by day of week and hour. An anomaly is a clear deviation from that curve, so setting thresholds before collecting a few weeks of data is misleading.
What are typical energy anomalies?
Four kinds of deviation are common.
- Out-of-hours use: load on a circuit that should be off at night or at weekends.
- Base load creeping up: a wearing device or forgotten equipment.
- Sudden spikes: a fault, a short-circuit tendency or wrong operation.
- Unexpected drops: a stopped machine or a lost supply.
How does energy data link to the carbon footprint?
Measured energy (kWh) multiplied by an emission factor gives the carbon footprint. The factor is the current grid value from official sources; it changes by year and source, so a report should state where it came from.
In its energy analysis and anomaly detection solution Renokta uses LoRaWAN current transformers and smart plugs as well as data from analysers read over Modbus.
Frequently asked questions
- What is an energy anomaly?
- A clear deviation of a circuit from its normal consumption curve. Out-of-hours load, a creeping base load, sudden spikes and unexpected drops are typical examples.
- Can a current transformer be fitted without cutting the cable?
- Clamp-on current transformers fit around the conductor without cutting it. Working inside a panel is risky, so qualified electrical staff must install them.
- How much data is needed before setting alarm thresholds?
- A few weeks. The normal curve is built by day of week and hour, and thresholds set without data are misleading.
- Which circuits should be sub-metered first?
- Big loads such as lighting, HVAC, production lines and refrigeration, plus key equipment like a compressor, pump or oven that takes a large share alone.
- How is energy data converted to a carbon footprint?
- Measured kWh is multiplied by an emission factor. The factor changes by year and source, so the report should state where it came from.